

In 2006 the World Health Organisation coined a new term: “the Glasgow Effect”. It resulted from an analysis of life expectancy data in two neighbourhoods in Glasgow, Scotland. One, a prosperous upper-middle-class village outside the central city, Lenzie, had a life expectancy for a male child at birth of 82, up there with the highest in the world. In the other, a desperately poor and drug-riddled central city community called “the Calton”, a newborn boy could expect, on average, a lifespan of only 58 years (1). The two neighbourhoods are 5 miles apart geographically, but about 90 years in terms of the change in the life expectancy in developed countries over time.
Changes in life expectancy
Experts pretty much agree about the factors that increase life expectancy. The factors diminishing the lives of people living in the Calton are also generally agreed on: poverty, certainly, but also massive drug problems, criminality, poor nutrition, joblessness, and poor access to medical care. In the words of Janey Godley, a woman who lived in that part of the city for many years and wrote a searing book describing what that life was like (2), “. . . answers lie in repairing a fragmented society where many people feel they do not have control of their lives.” Godley describes how, in 1979, things went from abysmal, with high rates of alcoholism and criminality, to catastrophic following an influx of heroin. This drug was brought into the community by Iranians who had supported the Shah and were now fleeing the revolution. Unable to bring cash, they bought large quantities of heroin and sold it at previously unheard of low prices in Britain.

The Calton is an outlier in the story of life expectancy in the 20th century, at least in developed world countries. Generally, it has only gone up. Figure 1 illustrates the changes in life expectancy in the USA since 1900. It’s an impressive trajectory, with an overall increase of 65% during the twentieth century. But there are some surprises.
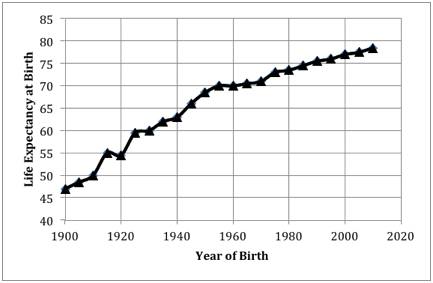
Many people think that the real difference in longevity occurred when antibiotics, beginning with the miracle of penicillin in the early 1940s, came into medical practice, and halted infections. But the graph shows a smooth, continuous increase with time. There is only a small bump during the ’40s and ’50s. Earlier changes in sewage treatment, availability of clean water, and better nutrition had more of an effect. For example, the number of deaths from tuberculosis in England and Wales fell by 87% between 1840 and the end of World War II, when Streptomycin, the wonder drug that cured the disease, became generally available (3).
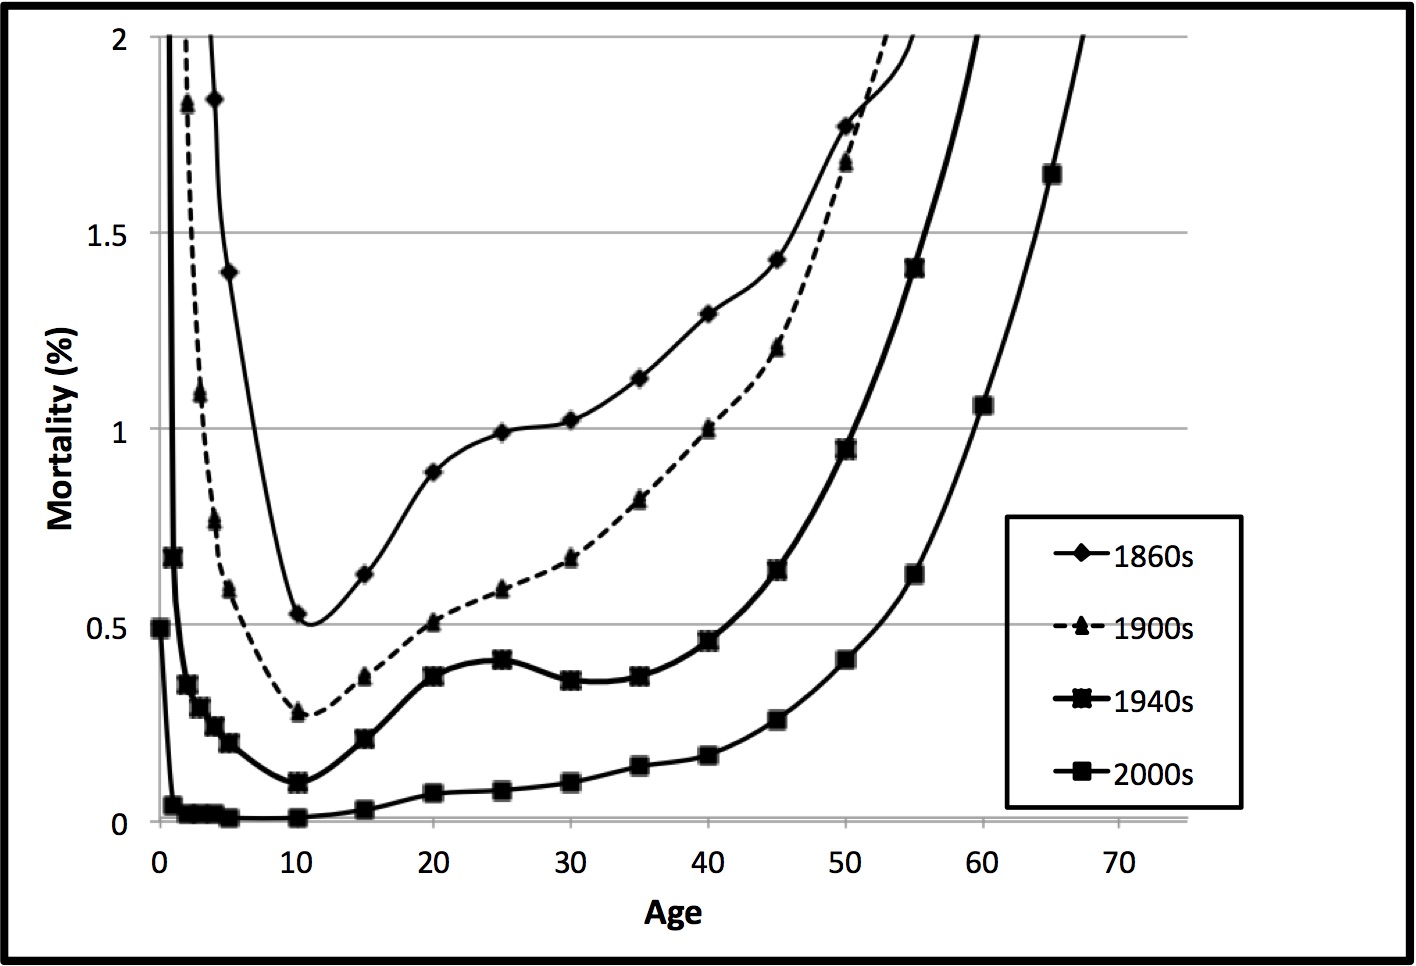
Another misunderstanding about life expectancy is that the increase is largely due to the prevention of infant mortality and the deaths of children. And indeed, mortality was very high 150 years ago; the death rate before the first birthday was 14% in Scotland in the 1860s (Scottish information is particularly well documented; where the data overlap with data from other countries, they are essentially the same). The data in Figure 2, while supporting the notion that we now see very little childhood and infant mortality compared to earlier times, also demonstrate that death rates at all ages are lower. For example, the chance of dying at age 30 in the 1860s was 1%, but that rate of mortality was not seen until age 40 in 1900-1909, and not until age 60 at the beginning of the 21st century.
A casual look at these data could suggest that our lifespans may go on increasing for a long time to come, and reach who-knows-how high-values. I think too much optimism (if that can be considered an optimistic thought) is not warranted, as I explain in the second post about Life Expectancy.
Go to Latest Posts
Notes and Sources
- Reid, M. 2011. Behind the “Glasgow effect”. Bulletin of the World Health Organization 89:706-707.
- Godley, J. 2006. Handstands in the Dark. Ebury Press, UK.
- Hertzman, C. 2001. Health and Human Society: Wealthier nations are not always healthier, and efforts to improve health can be swamped by the effects of inequality and conflict. American Scientist 89:538-545.


Interesting. Makes you want more
This actually replied my problem, thank you!
Great post. I ‘m confronting a couple of these issues.