How long can you expect to live? The answer to that question is all about statistics and probabilities: some of us will die this year, some of us will live to 100. But what, exactly, do the statistics folks mean by ‘life expectancy’? It turns out to be a little complicated.
‘Life expectancy at birth’, a term we often see, doesn’t represent anything real: it’s a statistical creation. But when you understand it, it makes sense. For example, in 1961, the ‘life expectancy at birth’ in my country, Canada (fairly similar to most other countries of the ‘modern world’), was 71.2 years. That isn’t necessarily how long a person born that year would live, on average. To get that number, we would have to collect data on when half the people born in 1961 died, and that would take something like 71.2 years (actually, that would provide the median, not the average). We wouldn’t know that number until about 2032; not very useful for the statistician or the life insurance industry. What to do?
To calculate ‘life expectancy at birth’ the statistician begins with something called a ‘life table’ for that year. This table shows the mortality (or its inverse, the survival) for each age cohort. For babies born 1961 in Canada, mortality during the first year of life was 2.75%. (Mortality during the first year of life has come down a lot over the years. In 1921, it was almost 12%; by 2021 it was down to less than half a percent. This is discussed a little further in the section below.)
Excerpt From the Life Table for Canada, 1961
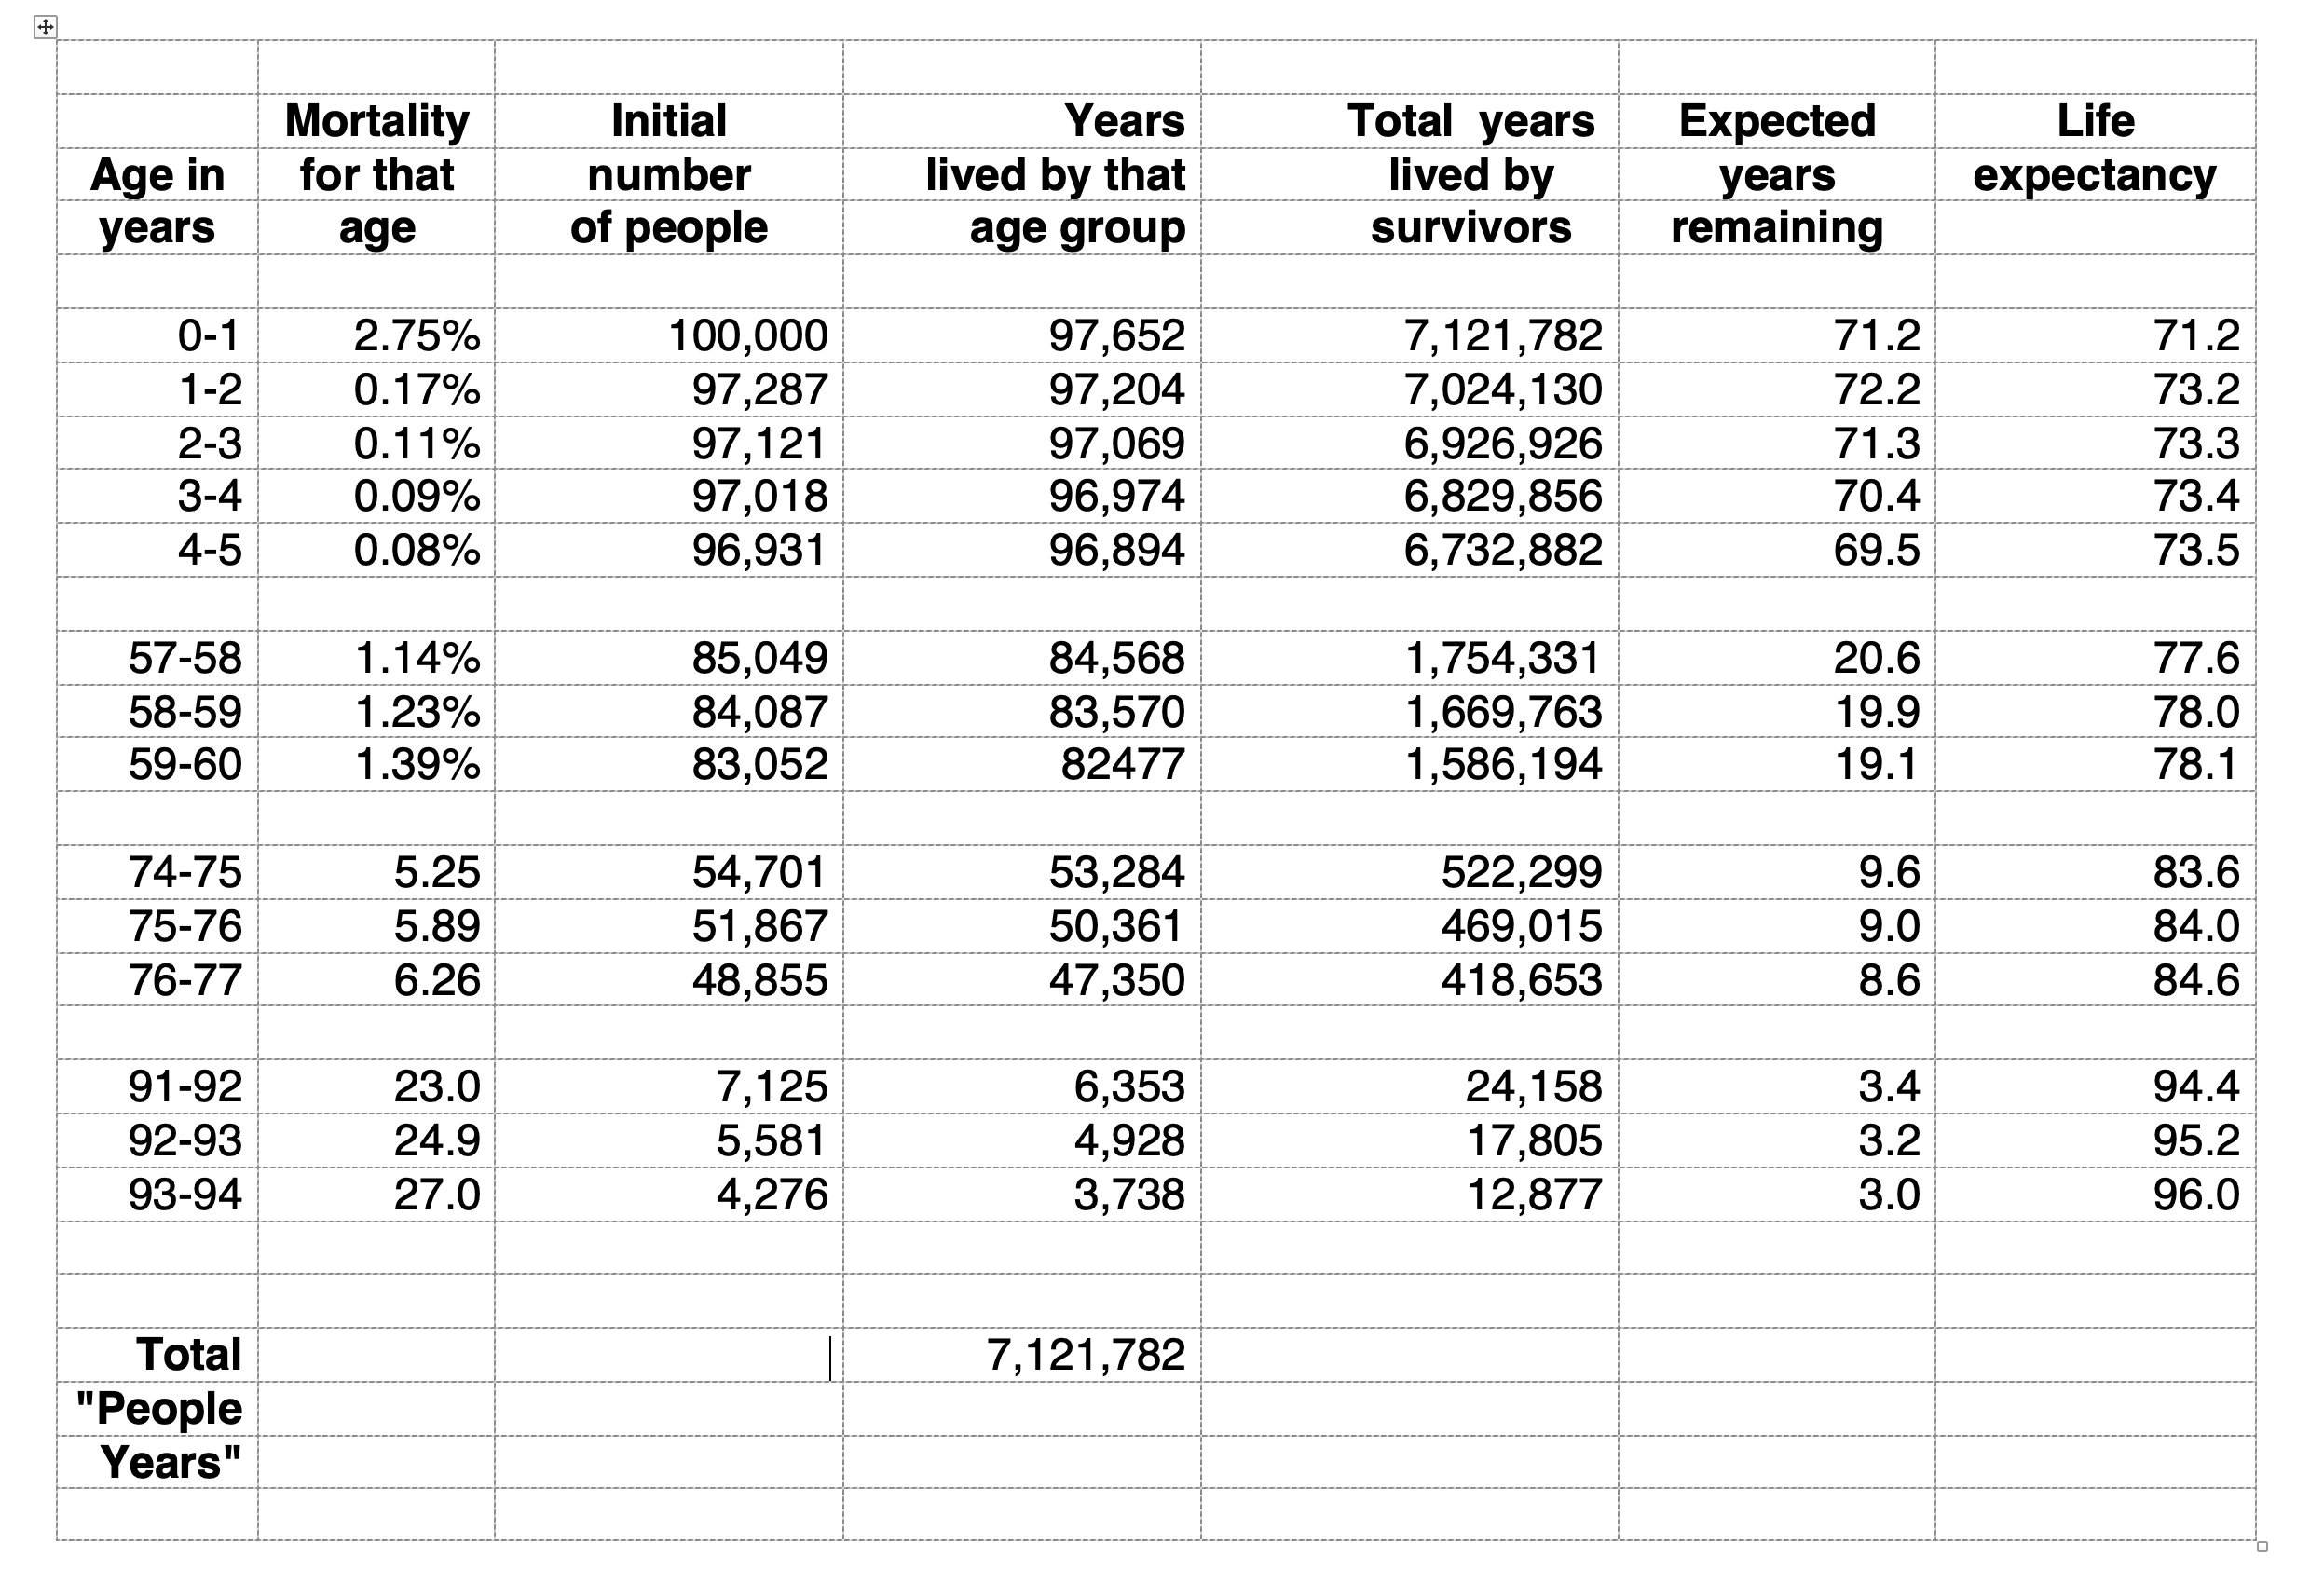
So, for every 100,000 babies born 1961, 2.75%, or 2,713, died before their first birthday. Of children who were between the ages of 1 and 2 in 1961, another 0.17% died that year (166 children of the 97,287 who survived their first year of life). But that number isn’t the survival of 1-year-olds born in 1961; it is the survival of babies who were in their second year of life in 1961. The life table gives survival numbers for each year of age for 1961, based on the projected number of survivors for that age.
For every 100,000 babies born in 1961, they lived, altogether, 97,652 years of life that first year. That number isn’t exactly the same as the number of survivors; some were born and some died at various times during the year.
For 1961, mortality declined for the next few age groups, until it started to go up again, slowly. Survival was above 99.9% until age 19 (in 2021, that lasted until age 31). In 1961, more than 1% of people in their 57th year died, and the mortality then increased for the older years until it topped out at 100% for the single individual who was 110 years old that year.
Each age cohort enjoys one year of life per person each year. Those who were between 57 and 58 in 1961, of whom there were project to be just over 85,000, enjoyed 84,568 years of life. Those numbers are in the fourth column of the life table . The key statistic, life expectancy, is obtained by adding up all the years of life enjoyed by those who are older than the age of interest. This number, for every 100,000 newborns in 1961, is 7,121,782 years. Divide that by the number of newborns, 100,000, and you get the official ‘life expectancy at birth’, or 71.2 years.
Total life expected increases for older cohorts, because they’ve escaped dying at a younger age. All the people older than 58, taken together, were predicted to enjoy a total of just over 1.75 million years in 1961. For the 85,000 57-year-olds going into that year, then, there was a further life expectancy of 20.6 years (1.75 million divided by 85,000), which means the 57-year-olds could expect to live to 77.6 (present age 57 + 20.6 additional years). The 90+ year olds have long surpassed their life expectancy at birth, and can expect a few more years of life.
Again, this table doesn’t follow the 1961 cohort through their lives; it simply uses the survival data for 1961 to calculate the life expectancy for each age, from the ratio (years of life expected for each age based on the survival numbers, divided by the number of people of that age). (If all the factors that influence survival remained exactly the same over time, then the numbers for 1961 would also represent the life expectancies in future years; but conditions change, and so do the survival statistics.)
So, what about the Canadian born in 1961, now 63 years old? To know how much life they could expect today, you would need to see a life table for 2024. That table isn’t available yet (it takes time to collect all the numbers for a given year), but we do have a table for 2022, and it says that someone who was 61 years old in 2022 (i.e. was born in 1961) could expect to live another 24 years, to 85. From the complete life table for 1961, 63-year-olds that year could expect to live only a bit past their 79th birthday. Progress.
How has life expectancy changed?
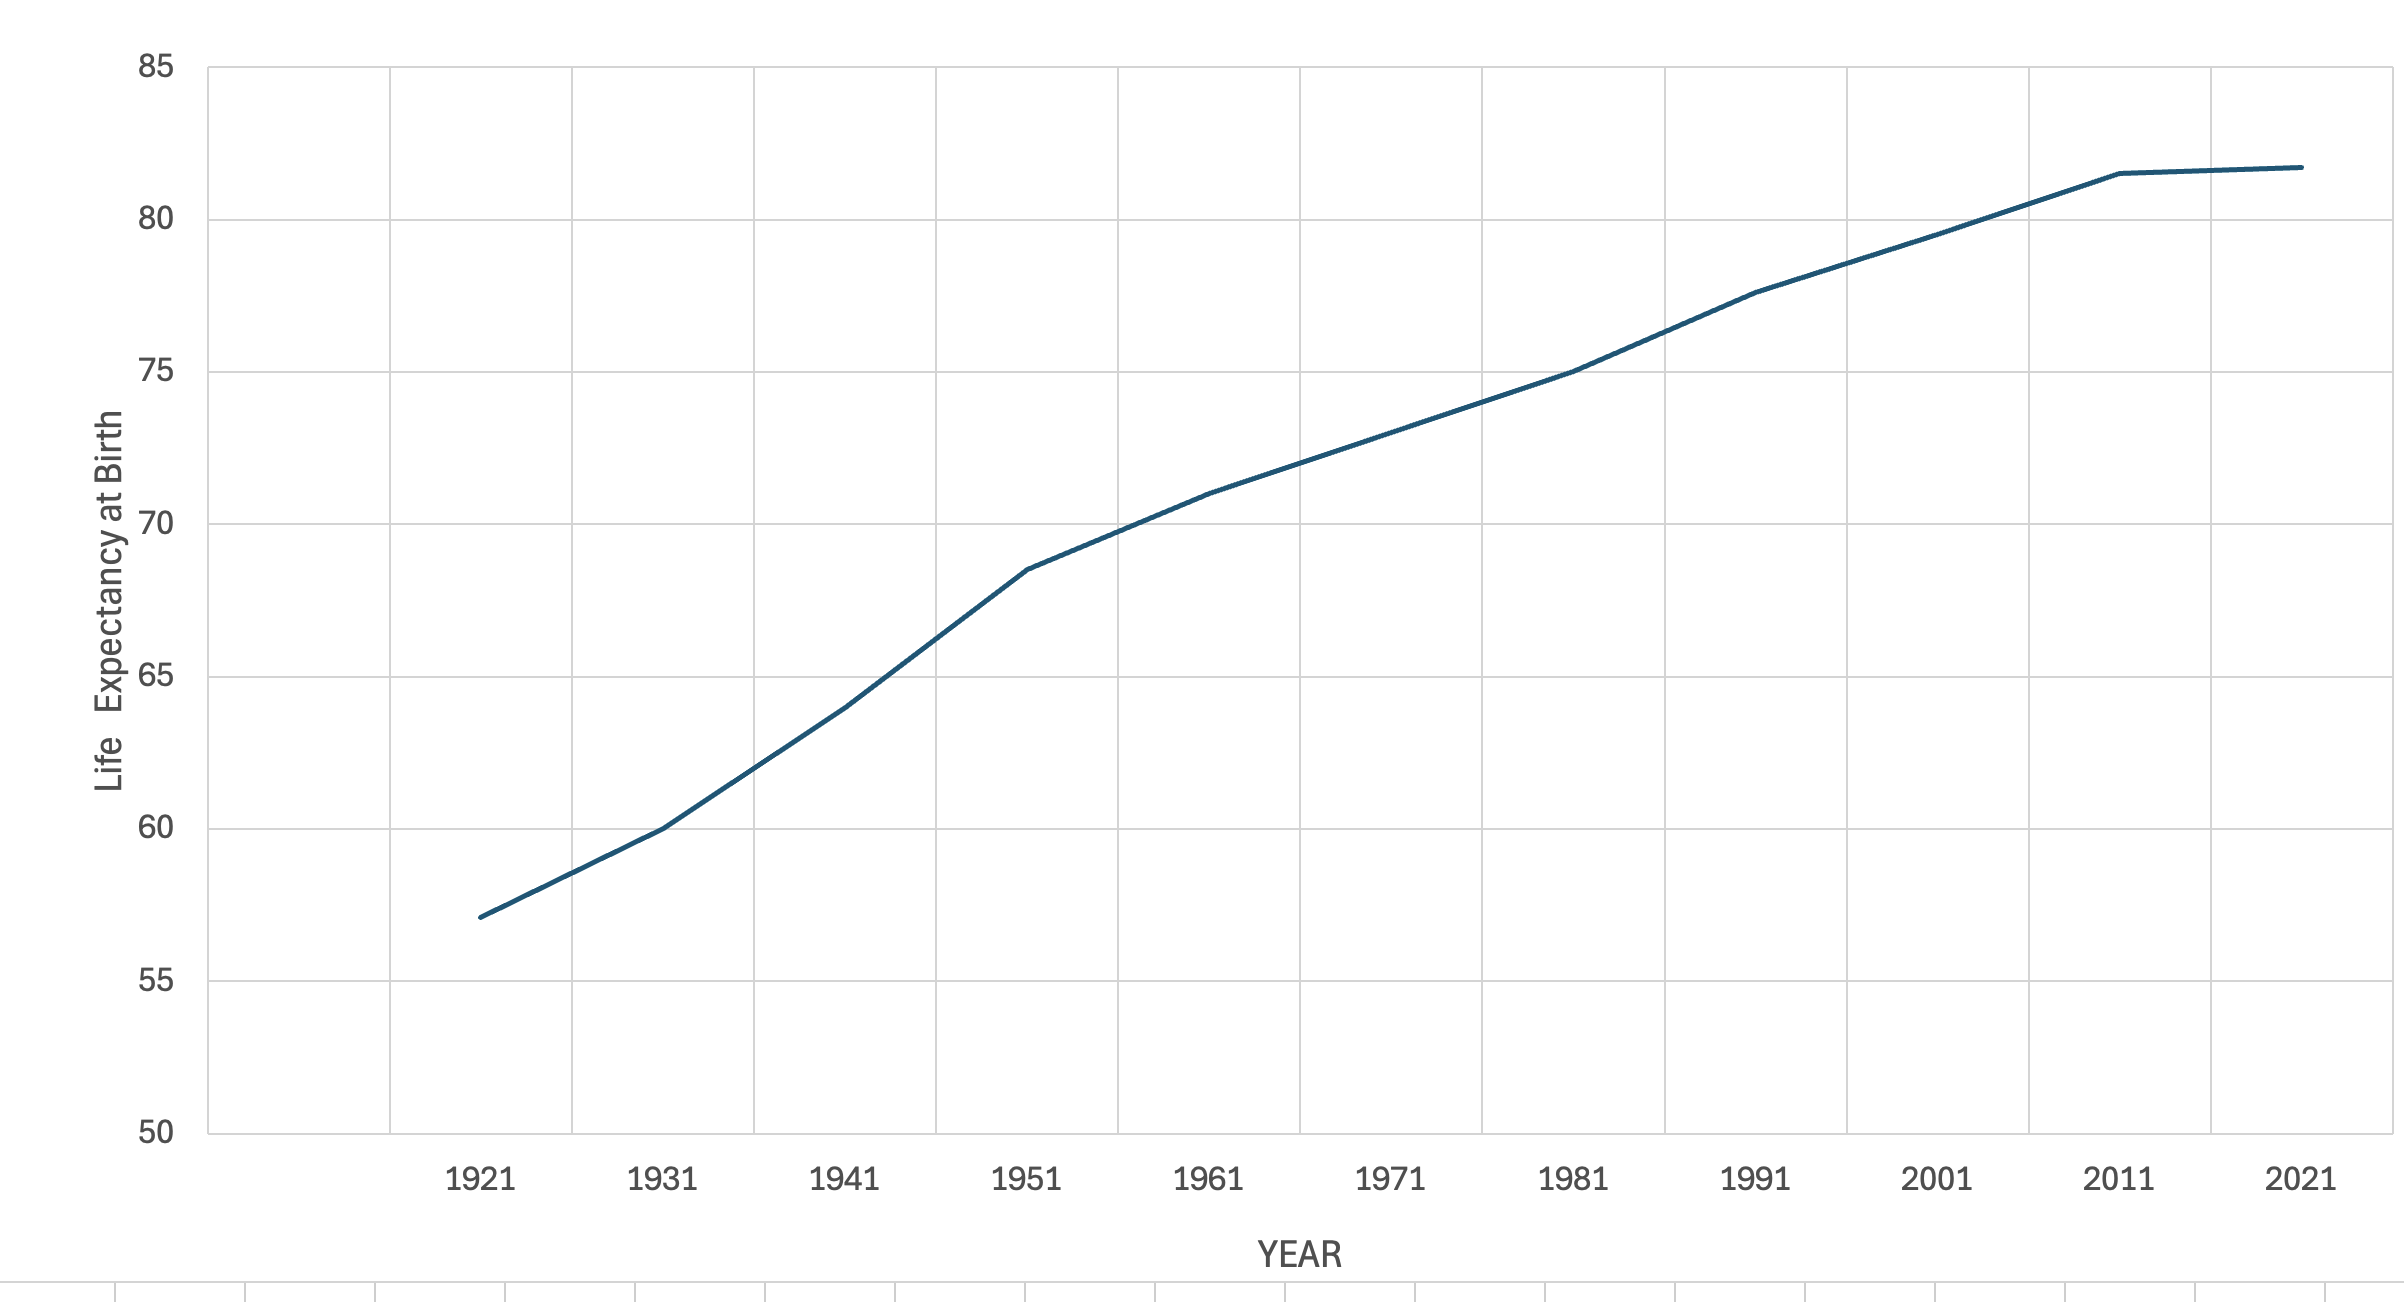
We are well aware that life expectancy has increased over the past century. We also know some of the factors responsible for this: antibiotics, better sanitation, more wealth (a very good correlate with life expectancy), improvements in treating newborns, and so forth. This produces the curve below (for Canada), which shows life expectancy at birth rising from around 57 in 1921 to about 82 today (back in 1900, it was 50).
 Total life expectancy at birth and at 15 and 80 years of age
But it isn’t just better survival numbers for newborns; 15-year-olds have also seen a significant increase. In 1921, there was a lot of death between birth and 15 years of age (the middle curve). But by about 1991, there was very little, as the curves for newborns and 15-year-olds are almost the same. Clearly, in addition to lower infant mortality, childhood deaths also decreased.
Not unexpectedly, 80-year-olds can now expect to reach 90, having survived all the threats to life in their first 80 years. That number hasn’t changed much, but the number of people reaching 80 has: in 1921, about 23% of Canadians were 80 or older; by 2021, that number was almost 3-fold higher, at 66%.
Reference
https://www.prdh.umontreal.ca/BDLC/data/can/bltper_1x1.txt

