

“I think the notion of ‘calories in vs. calories out’ is ridiculous.” So begins a recent online article about diet. Typically, it cites no external sources of information for this opinion. Actually, the calories in – calories out equation is a truism; thermodynamics doesn’t make exceptions, and one way or another, those input calories have to go somewhere. But the thought underlying the denial of equivalence is usually something different, such as, why does my friend eat anything she likes and stay slim, when I can’t? Or, there must be an easier way to lose weight — isn’t there a magic diet? Calories in can’t always be equal to calories out, can it?
There are complexities around this calories in – calories out business. For example, it’s true that a larger fraction of the energy content of protein is “lost” during its digestion, compared to fat, so protein will deliver fewer net calories. But the difference is small compared to the total number of calories involved. The critical issues is that “calories out” are used for both activities and heat (and a highly ketogenic diet will also cause calories to be excreted). It’s still true that, once we consume them, the calories have to go somewhere. However, the efficiency with which we use them to power the body’s functions, and the portion that gets converted to heat, can be different for different people.
The importance of the Basal Metabolic Rate
Nutritionists divide human energy metabolism into three compartments. The first, and for almost all of us the largest of these, is the Basal Metabolic Rate, abbreviated BMR. This is the rate of energy consumption when our bodies are completely at rest: it is measured when a person has just awakened from a good sleep, not having recently eaten, comfortable, and psychologically at ease. BMR is responsible for 60-70% of our body’s energy expenditure. Another 25-30% of the total energy in our food, depending on how active we are, is consumed by physical activity, and about 10% by the digestion and distribution of the food. (There are exceptions. A rider in the Tour de France expends more energy on pumping the pedals than on his BMR.) (A parameter similar to BMR is “Resting Metabolic Rate”, in which the person just has to relax on a couch or comfortable chair for about 20 minutes. It takes less preparation time than BMR, but is not as fundamental a property. For example, the digestion of a recent meal, or other activity, would increase the Resting Metabolic Rate, and make it larger than the BMR.)
Why does BMR consume so much energy? Breathing, the circulation of blood and the beating heart are all part of it, but a large part is used to maintain fluid levels in tissues, and proper levels of ions such as sodium, potassium and chloride, and other essential activities. About 20% of the total energy consumed in humans is used to power the brain, a non-optional activity that is somewhat increased by intense cognitive activity. Other organs, such as the liver and kidneys, account for a significant fraction of the energy expended as part of the BMR. BMR has a large effect on the relationship between what we eat and the shape our bodies take, whether below-average weight for our height, in the normal range, or overweight or obese.
Variation in BMR
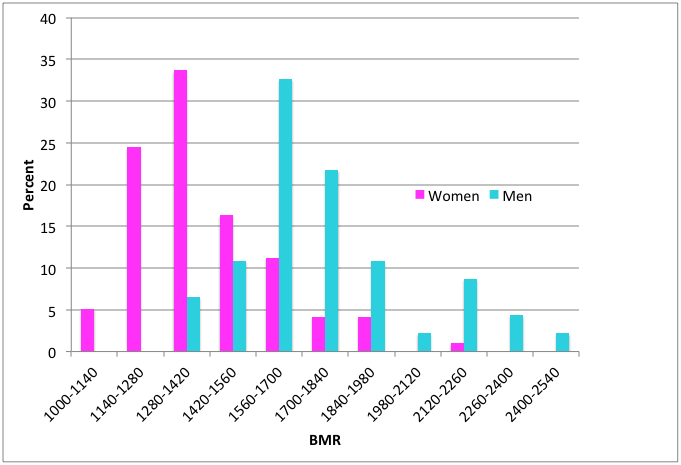
We’ve all heard the complaint, and maybe made it too, that some lucky people seem to be able to eat anything and still not gain weight. This could be because they expend a lot of nervous energy; they may be “knee bouncers”, or do a lot of manual labour. But it could also be the result of having a higher BMR, which increases baseline energy consumption. And there are such people, as shown by the results of a study of 150 Scottish adults (Figure 1). Their BMRs, measured in kcal per day, have over a 2-fold range. (One kcal is equal to the kilocalorie, 1,000 calories, the fundamental unit of food energy. A pound of cheese, 454 grams, contains about 1,800 kcal.) If the dataset had included more people the distribution would have been smoother. The main point is that different people have different BMRs. Since the BMR reflects about 60-70% of total energy expenditure, this will influence how much food they need to keep a constant weight.
What causes differences in BMR?
There are several well-understood factors that influence BMR. The single most important one is what nutritional scientists call “fat-free mass”. This includes skeletal muscle, bone, organs such as the heart and liver, connective tissue and water. Muscle, for example, is a busy tissue, and takes more energy to maintain than fat. It needs a copious blood flow, and lots of pumping of ions (sodium and potassium) to keep its electricals working. On a per-pound basis, the heart and liver, and other organs, use even more calories to maintain themselves than skeletal muscle. When the BMR data from the Scottish study were plotted against the fat-free mass of each person, there was a direct correlation, but also a lot of scatter (1). Fat-free mass is roughly proportional to body size, so it’s not surprising that BMR is proportional to body size as well — large bodies need more energy.

Figure 2 shows that the correlation between BMR and fat-free mass is not perfect (note that it is logarithmic, with BMR proportional to about the 2/3 power of fat-free mass). There’s scatter in the data, and the authors determined that fat-free mass accounted for only 63% of the difference between the BMR values of individuals. It may surprise most people that the relationship between BMR and fat-free mass is the same for women as for men; women have a lower BMR primarily because they are smaller.
What about the rest of the variation in BMR; what are the factors that cause BMR to deviate from a perfect correlation with fat-free mass? The second-most important factor that we can measure and show to be important is the amount of body fat. Fat tissue consumes energy and influences the BMR, but a gram of fat uses only about one third as much energy as a gram of skeletal muscle (2). Body fat content accounts for about another 6% of the variation observed between BMR values.
Things that don’t make much difference to BMR
Surprisingly, age plays only a small role in the variation of BMR, about 2% after fat-free mass and fat are taken into account. The decrease in BMR in older people is largely due to a decrease in fat-free mass, particularly skeletal muscle. Their overall lower energy use, and calorie intake requirement, generally also includes a lower level of physical activity.
A more sophisticated analysis of the relationship between dietary intake and body mass includes the role of leptins, hormones released by fat tissue, which signal satiety to the brain, and thyroid hormones, which regulate many body functions related to energy use. The Scottish study did look at these parameters. Differences in leptin levels did not account for significant variation in BMR. As for thyroid hormones, we know that pathological conditions that profoundly change thyroid hormone levels (hyper- and hypothyroidism) can lead to major changes in BMR. But in this work, there was no correlation between triiodothyronine and BMR, and only a modest relationship between thyroxine and BMR for men, but not for women. Variation in BMR is not explained by differences in thyroid hormones or leptins in healthy people.
What accounts for the rest of the variation in BMR?
Part of the variation in BMR in the Scottish study, 27%, remained unaccounted for. This is one source of difference that we think we see when we look at our lean friend who seems to be able to eat anything, yet stay svelte. What accounts for it? Of course, our friend may simply be more physically active. But genetics also plays a role. An earlier study showed that identical (“monozygotic”) twins had more similar BMRs than non-identical (“dizygotic”) ones (3). In other words, twins who shared all of their genes were more likely to have very similar BMRs than those who shared only half their genes. But putting an exact number on that effect is difficult. It could be as high as 27%, or it could be smaller.
The upshot is that different people with the same body makeup can have different BMRs, and this will influence how easily they can maintain weight, and how hard it will be for them to lose it.
We biochemists have a strong affinity, a compulsion even, for quantitative analysis of metabolism. Aren’t all of our bodies constructed in the same way, and shouldn’t we therefore have the same “efficiency” of energy metabolism? (“Inefficiency” reflects the fraction of our caloric intake that is converted to heat.) Well, human metabolism, although it’s a well-understood system, is not that simple. The complete explanation is complicated, but basically, the machinery of energy metabolism can vary in efficiency without flouting any rules of thermodynamics or going outside any metabolic pathways. One basis for variation is the phenomenon of “coupling”. Coupling describes the fact that our metabolism tightly links foodstuff consumption to energy requirements, and in turn, to the generation of heat. If we work harder, we consume more foodstuff. There’s a close linkage, or coupling, between the two, and the nature of that linkage is well understood.
But coupling can vary. For example, babies have brown fat, in which coupling is looser than in white fat. This means that they will generate more heat, relative to their energy requirements, than adults. Babies have a high ratio of surface to interior, and brown fat is an important way for them to stay warm. (Cold-adapted adults can also lay down brown fat.) The uncoupling in brown fat is due to an “uncoupling protein”, which can also have an effect in other situations. When it does, the BMR will be increased as more “fuel” is converted to heat. In terms of electrical circuits, it’s like having a low resistance connection across the terminals of a battery that leaks off charge and produces heat.
There are other mechanisms that can account for changes in efficiency of metabolism. Some parts of metabolic pathways are called “futile cycles” because they just burn up calories. These are not pointless metabolic components; they make it possible to exert exquisite control on certain pathways, at the cost of some energy lost. But they do affect the efficiency of overall energy metabolism.
Calories in – calories out
Natural variation in BMR can account for different caloric requirements between individuals, at least to some extent. Energy expenditure by work or exercise is, of course, also important. An extreme example of this is described in another posting on this site, comparing the energy expenditure of two groups of Pima Indians living in Arizona and Mexico, respectively. The two groups are genetically essentially identical, having separated a few hundred years ago. The Mexican group has a subsistence farming life, and expends 500 kcal a day more on work than the Arizona group, which is quite sedentary (their food intakes are similar) (4). As a result almost entirely of different energy expenditures, the Mexican group is of normal weight, while the Arizona group has the highest rate of obesity, and Type II diabetes, in the world.
There’s a quite convincing demonstration of how calories in and calories out are connected at a population level. To illustrate this, it’s helpful to introduce a measure of human body type, the Body Mass Index (BMI). I’ve described this parameter, and how it can be determined, elsewhere on this site. What it reflects is how heavy we are for our height. Nutritional scientists find it to be a useful number to track body type, whether normal, underweight, overweight, or obese.
What is the relationship between food intake and body mass index?
If two people of equal body mass and BMI, and the same daily total energy expenditure, begin to consume different amounts of food, they will begin to diverge in weight. Say two men, aged 40 years, start off at the same 77 kg (170 pound) weight. Bob continues to eat and work as before, but Frank increases his intake of food by just 140 kcal a day (roughly one regular Coke). If everything else stays the same, Frank will start to gain weight at a rate of about 1 pound per month. His weight gain won’t go on forever. He’ll probably stabilize at about 86 kg (190 pounds) because his now larger body will have a higher BMR (by 140 kcal per day).
What if the Bob and Frank experience is translated to the whole population? The US Department of Agriculture keeps records of how much food is provided to consumers, and how much is actually eaten (there’s a tremendous amount of waste due to shipping loss, the discarding of less than perfect products, and food that is thrown out by consumers). This agency estimates that between 1970 and 2010 the amount of food consumed, per person in America, went up from 2,024 kcal per day to 2,538. This shocking 25% increase is described here. (To see the data, which are on a spreadsheet, click on “Calories” under “Loss-adjusted food availability”.)
Changes in the kind of food eaten, particularly a sharp increase in fat consumption, largely account for the increased caloric intake. If calories in equals calorie out, an increase of such magnitude in caloric intake should lead to an increase in BMI. And that’s exactly what we see.
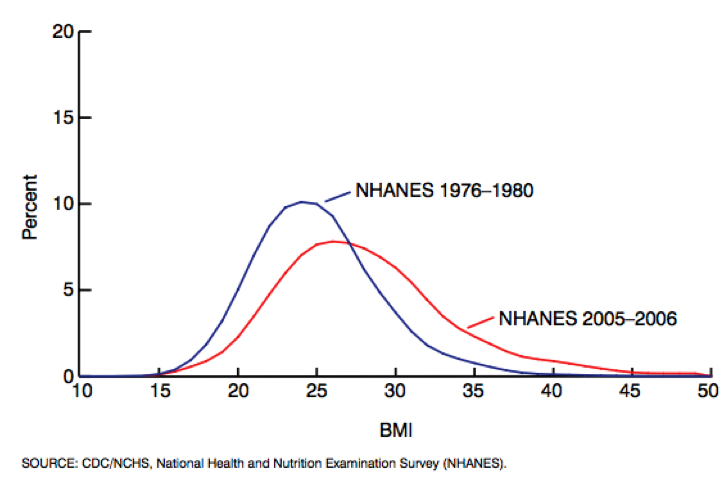
The US Centers for Disease Control and Prevention has a program (NHANES) that keeps a close watch on the diets and health of its citizens, including their BMI. A particularly revealing statistic is the change in BMI between the periods 1976-1980 and 2005-2006. (The NHANES data can be found here) In the late 1970s, the average BMI for adults in the United States was around 24.5, which is in the “normal weight” range (20-25). But by 2005, the average was around 27 for men and women, which is in the overweight range (25-30) (Figure 3). For a person of height 1.78 meters (5 feet 10 inches), an increase in BMI from 24.5 to 27 would represent a weight change of almost 8 kilograms (17 pounds), from 77.6 to 85.3 kilograms (171 to 188 pounds). More disturbing, by 2005-6 about 30% of American adults had a BMI above 30, which defines obesity (and another one-third were overweight). That increased food intake measured by the US Department of Agriculture had to go somewhere.
Could that change be due to something other than food intake? One factor may be a lower level of physical exertion. Ageing of the population may be partly responsible, since older people generally have a higher BMI due to less muscle mass and physical activity. But age-restricted comparisons look much like the overall results in Figure 3. And our metabolic machinery has not changed efficiency over such a short time.
Personal characteristics can certainly lead to differences in BMR, and thus BMI for a given intake of calories. Some people can eat more than others without gaining weight, and they can at least partly thank genetics for that. But for the population as a whole, the increase in BMI, and the fraction of overweight and obese people since 1976, is pretty clearly a result of more food consumption. Calories in equal calories out.
Work cited
- Johnstone, A. M., S. D. Murison, J. S. Duncan, K. A. Rance, and J. R. Speakman. 2005. Factors influencing variation in basal metabolic rate include fat-free mass, fat mass, age, and circulating thyroxine but not sex, circulating leptin, or triiodothyronine. Am J Clin Nutr 82:941-948.
- Wang, Z., Z. Ying, A. Bosy-Westphal, J. Zhang, B. Schautz, W. Later, S. B. Heymsfield, et al. 2010. Specific metabolic rates of major organs and tissues across adulthood: evaluation by mechanistic model of resting energy expenditure. The American Journal of Clinical Nutrition 92:1369-1377.
- Henry, C. J., S. M. Piggott, D. G. Rees, L. Priestley, and B. Sykes. 1990. Basal metabolic rate in monozygotic and dizygotic twins. Eur J Clin Nutr 44:717-723.
- Esparza, J., C. Fox, I. T. Harper, P. H. Bennett, L. O. Schulz, M. E. Valencia, and E. Ravussin. 2000. Daily energy expenditure in Mexican and USA Pima indians: low physical activity as a possible cause of obesity. Int J Obes Relat Metab Disord 24:55-59.
Go to Latest Posts


