

This post, renewed from a previous one, is a continuation of the one following, on BMR. It examines one of the ways of looking at bodies – Body Mass Index (BMI). BMI is not usually that great at estimating a person’s health and weight, but does have value in looking at populations. Read on.
Body Mass Index (BMI)
Body Mass Index, defined as body weight in kilograms divided by the square of height in meters, has been used for about 200 years to assign underweight, overweight, normal or obese labels to bodies. But applied to a single person, of and by itself, it isn’t necessarily a good estimator of body health — Arnold Schwarzenegger in his bodybuilding prime had a BMI of about 31, which is considered to be ‘obese’. His high BMI was, of course, due to Mr. Universe’s massive musculature, which made him look, in the unkind words of the essayist Clive James, like a condom filled with walnuts. BMI is a useful monitor of a person’s progress in weight control, but that can be determined by simply stepping on the bathroom scale.
Obviously, increased food consumption can increase a person’s BMI. How much? Say two men, aged 40 years, start off at the same 77 kg (170 pound) weight. Bob continues to eat and work as before, but Frank increases his intake of food by just 140 kcal a day (roughly one regular Coke). If everything else stays the same, Frank will start to gain weight at a rate of about 1 pound per month. He’ll probably stabilize at about 86 kg (190 pounds) because his now larger body will have a higher Basal Metabolic Rate (by 140 kcal per day).
The American Body Public
What if the Bob and Frank experience is translated to a whole population? The US Department of Agriculture keeps records of how much food is provided to consumers, and how much is actually eaten (there’s a tremendous amount of waste due to shipping loss, the discarding of less than perfect products, and food that is thrown out by consumers). This agency estimates that between 1970 and 2010 the amount of food consumed per person in America went up from 2,024 kcal per day to 2,538. This shocking 25% increase is described here. (To see the data, which are on a spreadsheet, click on “Calories” under “Loss-adjusted food availability”.) If calories in equals calorie out, an increase of such magnitude in caloric intake should lead to an increase in BMI. And that’s exactly what we see.
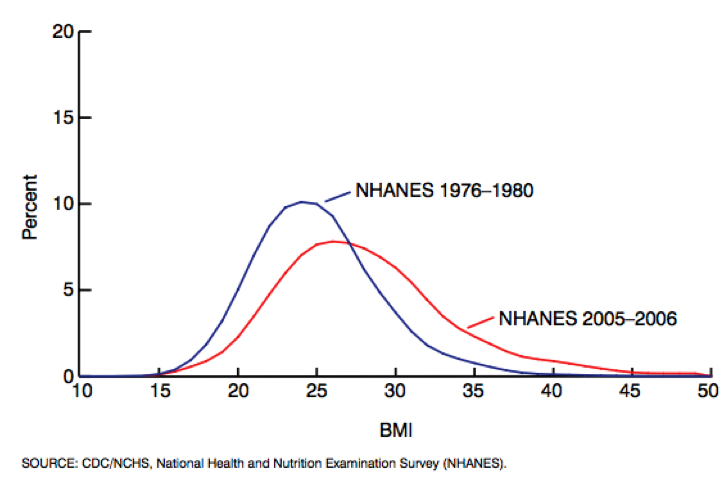
The US Centers for Disease Control and Prevention has a program (NHANES) that keeps a close watch on the diets and health of its citizens, including their BMI. A particularly revealing statistic is the change in BMI between the periods 1976-1980 and 2005-2006. (The NHANES data can be found here.)
In the late 1970s, the average BMI for adults in the United States was around 24.5, which is in the ‘normal’ weight range (20-25). But by 2005, the average was around 27 for men and women, which is in the ‘overweight’ range (25-30) (Figure 3). For a person of height 1.78 meters (5 feet 10 inches), an increase in BMI from 24.5 to 27 would represent a weight change of almost 8 kilograms (17 pounds), from 77.6 to 85.3 kilograms (171 to 188 pounds). More disturbing, by 2005-6 about 30% of American adults had a BMI above 30, which defines obesity (and another one-third were overweight). That increased food intake measured by the US Department of Agriculture had to go somewhere.
Could that change be due to something other than food intake? One factor may be a lower level of physical exertion. Ageing of the population could also be partly responsible, since older people generally have a higher BMI due to less muscle mass and physical activity. But age-restricted comparisons look much like the overall results in the figure. And the genetics of our metabolic machinery has not changed efficiency over such a short time.
The Pima Indians
An extreme example of a dramatic change in BMI of a group, and it’s effects on changing health, is found in the Pima Indians of southwest Arizona (described here). At the beginning of the twentieth century, the Arizona Pimas were successful farmers in a low-water environment, thanks to their expertise in water management. And they were lean and fit. Today, having been deprived of their source of water, they have largely left farming, and are dependent on government ‘aid’ in the form of high-carbohydrate surplus food. And they have some of the highest levels of obesity (70% of adults) and Type 2 diabetes (T2DM) (50% prevalence) in the world (1).
The genetically-related Pima living in the state of Sonora in Mexico are still hard-working farmers. And they have a level of T2DM of 5% and a level of obesity of about 10%, the same as the non-Pimas living near them. Whereas the Arizona Pimas engage in physical activity about 8 hours per week, the Mexican ones do on average 27 hours. The Mexican Pima are still lean and fit, despite taking in about the same number of calories as their Arizona cousins. Calories being burned by manual labor in Mexico are stored as un-needed fat in Arizona.
BMI and Staying Alive
While BMI is not an absolute measure of health, it does have an interesting relationship with staying alive, at least for a population. There’s an increased probability of death from all causes as BMI rises higher into the ‘overweight’ (BMI > 25) range. But the risk doesn’t go up appreciably until BMI is over 30. (There’s also a danger of death for very low BMI). This general trend is true for all age groups (and men and women are similar).
The trends are very similar in Europe, North America, Australia and New Zealand, East Asia, and South Asia. Of course, the overall risk of dying is much higher at age 80 than at 40 (in Canada, about 40 times higher). So the average 40-year-old person with a high BMI will outlive an average fit 80-year-old.
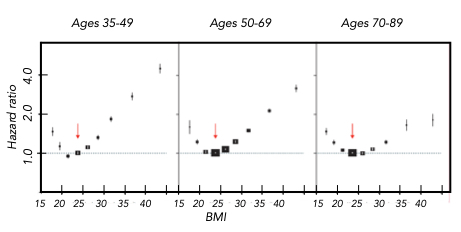
It’s quite noticeable that having a higher BMI is less of a danger at older ages. What you don’t want to be is young and overweight.
Go To Contents
References
- Diabetes mellitus in American (Pima) Indians. Bennett, P. H., T. A. Burch, and M. Miller. The Lancet 298:125-128 (1971).
- Body-mass index and all-cause mortality: individual participant data meta-analysis of 239 prospective studies in four continents. The Global BMI Mortality Collaboration. The Lancet 388:776-786 (August 20, 2016).


)