
Three years ago I posted an article called “The Efficiency of the Human Body”, and it has proven to be popular. Then I posted an update last November. I’ve now learned more about the subject, and thought about it, and it’s time for another upgrade. Naturally, upgrades almost always involve an expansion, so there are two pieces now: This one, which explores the distribution of energy use in the resting body (our resting metabolic rate) and the next, which includes the material in the original post by describing energy distribution in the body in motion.
The body at rest
The core of human energy metabolism from carbohydrate, fat, and protein is essentially the same at the molecular level in any aerobic (oxygen-consuming) tissue. It produces ATP, CO2, water, and heat. But we can look at the energy consumption of different organs or tissues to learn more about what’s going on. How is the energy economy distributed in the body at rest? And, what are the changes when the body goes from being at rest to being in action?
Imagine sitting calmly, comfortably, and at ease. You haven’t eaten recently, but you’re not hungry either. In this restful condition you may not be aware of muscular exertion, or energy expenditure, with the possible exception of breathing. You might think that you are consuming little energy, that your metabolism is at low ebb. Yet, in these resting conditions you are burning up calories at about 70% of the daily average. What goes on autonomously and subliminally is profoundly important.
Energy consumption under these resting conditions is the “Resting Energy Expenditure”, REE, which is almost the same as “Basal Metabolic Rate” (BMR), something you hear about more often. Measuring the BMR requires that you have just awakened from a restful sleep, and haven’t eaten for 12 hours. REE is easier and quicker to measure — prior sleep is not required, and you may have eaten within 12 hours. REE provides a picture of baseline energy consumption, which is the largest component of the energy used by the average person every day.
There’s a lot of variation in REE, or BMR, between individuals. A Scottish study in 2005 illustrated the range for a group of 150 adults whose body size distribution roughly mirrored that of the population as a whole (1). Scientists often correlate people’s BMR, or REE, with the “Fat-Free Mass”, FFM, which includes skeletal muscle, bone, organs such as the heart and liver, connective tissue and water — everything except adipose tissue.
There’s a fair correlation, with a lot of scatter (Figure 1). Interestingly, women and men are on the same curve — women on average have a lower BMR for the same reason as older adults — less muscle, smaller bodies. But some people have a BMR hundreds of kcal higher than others with the same FFM. Including fat mass in the Scottish study improved the correlation only a little — almost 27% of the variation was unexplained by these measurements.
The difference in BMR, or REE, between people is not directly affected by exercise. (There may be a secondary effect, as exercise can reduce adipose tissue and increase muscle mass, and muscle has a higher resting metabolism than adipose tissue (2)). But the difference in BMR for a given FFM means that yes, some people can eat a lot more than others for the same body size; or conversely, the same BMR can be found in people with quite different FFM.
Other factors that can influence energy metabolism include leptin, a hormone produced by adipose tissue which signals that fat synthesis and storage are not required. But leptin, and the energy-regulating thyroid hormones, did not reduce the scatter in the correlation in the Scottish study. Age played only a small role; about 2%, after fat-free mass and fat were taken into account. The lower BMR of older people is primarily because of their lower muscle mass.
A new way to predict REE
A more sophisticated type of analysis provides a better correlation and illuminates the body’s energy metabolism at a deeper level. In this method the sizes of the organs that consume energy are measured non-invasively (3). These include the liver, brain, heart, kidneys, skeletal muscle, adipose tissue, and “Residual Mass”, which includes skin, intestines, bones and lungs — everything left over. The idea is that each organ has a particular energy requirement in the body at rest, and this requirement is a product of the size of the organ and its energy consumption per gram. The assumption is that all livers, for example, consume the same energy per gram. Similarly for the heart and other organs. (Determining these energy consumption values is a major project in itself.) This assumption, the equivalent consumption per gram of any liver, for example, is supported by data, and the predictions it makes are observed. The kcal consumed per kilogram per day varies between tissues, as shown in Figure 2.
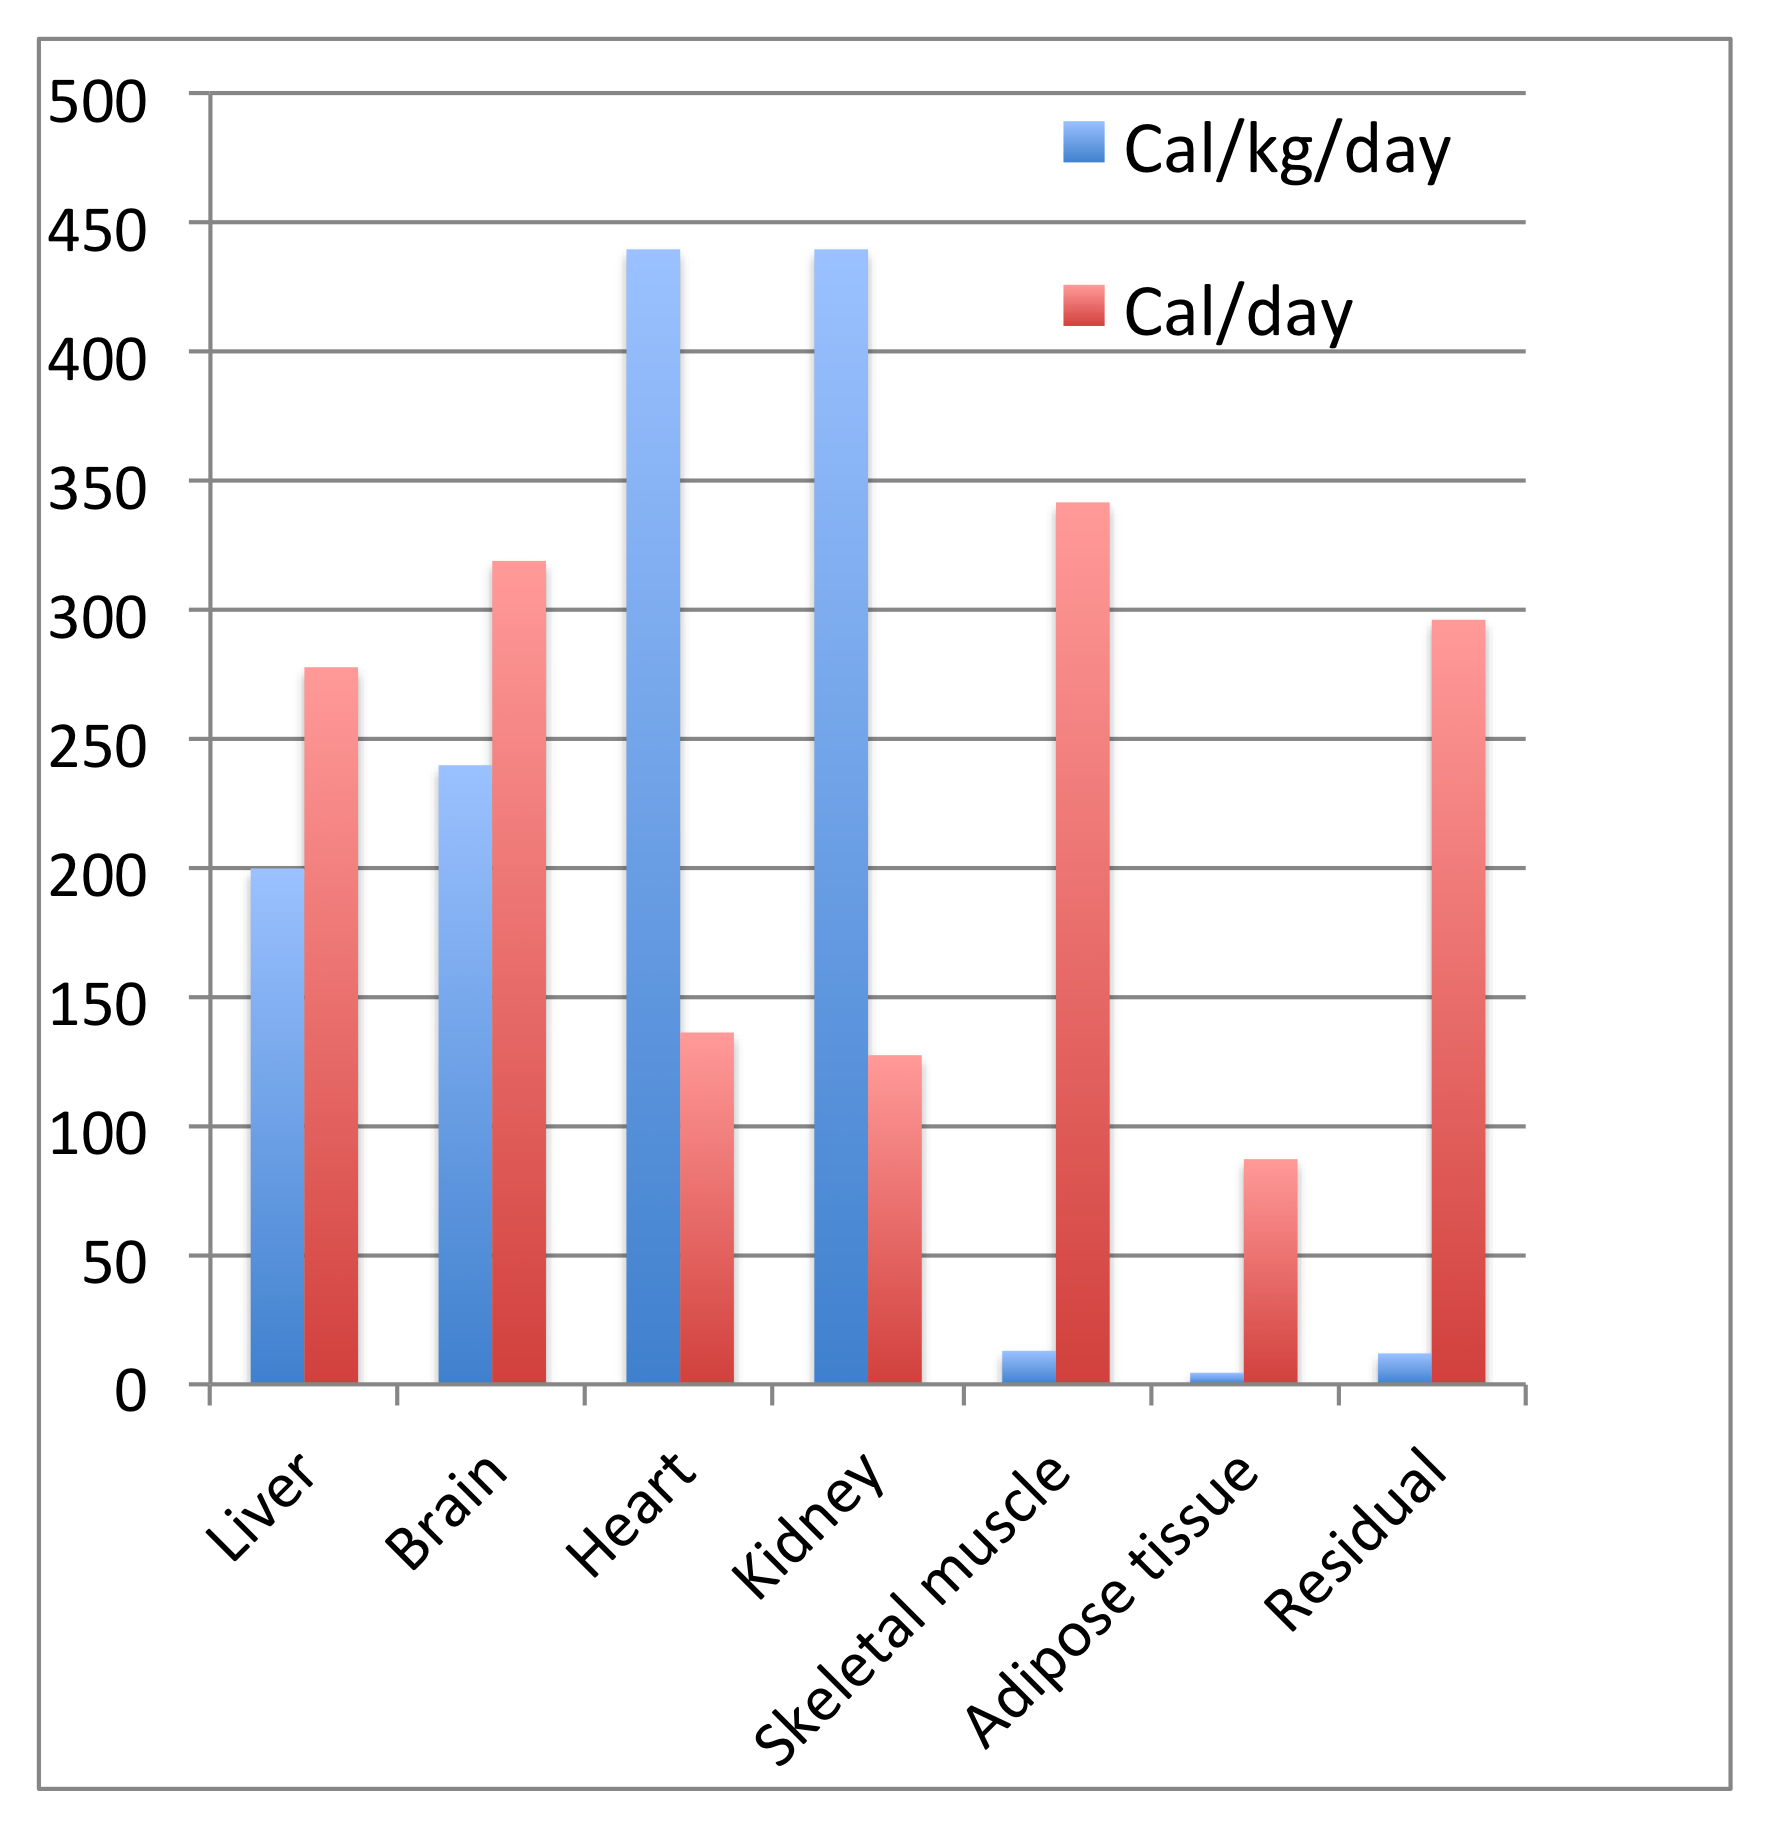
In the study described in Figure 2, the subjects ranged in age from 21 to 73 years (typical adult values only apply above 20 years of age), and included similar numbers of men and women. They were all in the normal range of Body Mass Index, a term that reflects the ratio of weight to height (BMI is described in another post). Their BMI values averaged 24, where 20–25 is the normal range, above 25 is overweight, and below 20 is underweight.
Figure 2 shows where our Resting Energy Expenditure goes for this group of normal-weight individuals. The four organs with the highest energy consumption per kilogram, those most metabolically active in the resting body, are the liver, brain, heart and kidneys. Skeletal muscle at rest consumes a very small amount of energy per kilogram (13 kcal/kg/day), and adipose tissue, which stores our fat reserves, only consumes 4.5 kcal/kg/day. The residual tissue is similar to skeletal muscle at 12 kcal/kg/day. But because skeletal muscle is relatively massive (about 35-40% of an average young male’s weight, 25-30% for an average young woman), its total consumption is large — the highest amount, at just under 350 kcal per day, of any of the organs listed.
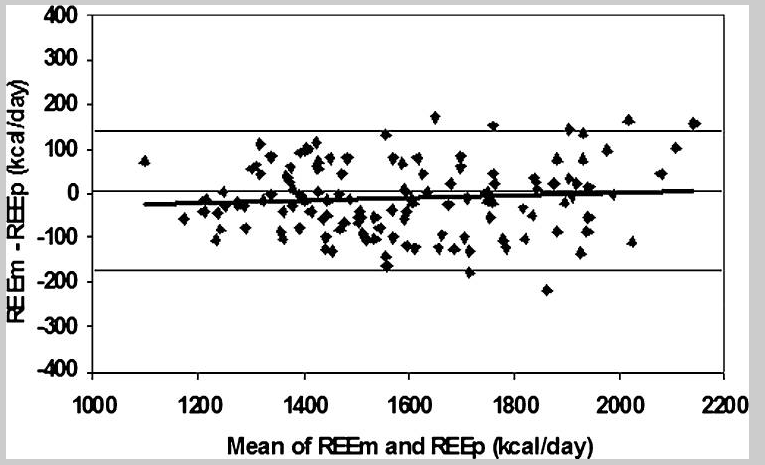
In this approach, the measured REE (REEm) was determined by indirect calorimetry, in which the exchange of oxygen with carbon dioxide is measured with a gas-monitoring mask, and the calories consumed are calculated from knowledge of metabolic pathways. (A “fudge factor” to account for protein is estimated to introduce an error of 2% or less.) The sizes of the various organs for each person were determined by magnetic resonance imagery, obtained by whole-body scanning in a magnetometer, or by dual-energy X-ray absorptiometry. The similarity between the predicted (REEp) and measured (REEm) (Figure 3) was a better fit than with the BMR-FFM correlation (Figure 1). It’s consistent with the idea that at rest, a given tissue, like the liver, consumes the same energy per gram per day in any individual.
A small deviation is seen after age 45; the measured REE deviates downward slightly. The difference between a 70-year-old and a 30-year-old amounts to about 3.5%. Smaller bodies and less muscle mass explain the lower REE of most women compared to most men. There’s no indication that the specific energy consumption per gram of the individual organs is different in women and men.
The energy needs of different organs reflect their different metabolic functions. Liver carries out many different tasks. It breaks down or reconfigures some nutrients, assembles others (for example, fats for storage), and stores yet others (glycogen, a polymer of glucose, which will be released when blood sugar levels begin to fall). It also neutralizes toxins, synthesizes urea (for excretion of nitrogen produced from degraded protein), and re-synthesizes glucose from non-carbohydrate materials during severe glucose depletion, amongst other functions.
The brain, not surprisingly, needs to work continuously, and at about the same level. What may be somewhat unexpected is its high specific energy consumption. The analysis in Figure 2 suggests that the brain consumes just over 15% of the total energy used by the body at rest, which is actually lower than most estimates (usually quoted is a value of around 20%). Most of the energy used by the brain (75%) is needed for signaling, which requires ion transport across synaptic membranes, an energy-intensive activity. An interesting question is whether the brain expends more energy when it’s hard at work; the answer is, yes it does, but the difference is minor, somewhat less than 10% of its average energy consumption.
The heart (blood circulation) and kidneys (blood filtration) consume the greatest amount of energy per kilogram. These organs, like the brain, work continuously. The skeletal muscles, adipose tissue, and “residual” tissue are much lower in their energy use per kilogram in a body at rest. This is not surprising for muscle: the resting muscle has little to do except maintaining proper sodium and potassium concentrations across cellular membranes. Muscle does store glycogen after a meal, as does the liver, but since REE is measured some time after the last meal, there is little glycogen storage going on during its measurement. The glycogen in muscle is not being actively broken down for energy until significant muscle work is required, when it provides glucose for glycolysis and aerobic energy metabolism.
Adipose tissue doesn’t do much, metabolically, in the body at rest and not actively digesting a recent meal. There is some turnover of the fats stored in it, as some triacylglycerol molecules are being broken down and others newly stored, but the overall level of energy metabolism is low. Fat is mainly a massive energy storage depot.
As for the “residual” tissues, the energy requirement per kilogram is also quite low, but the amount of tissue (skin, lungs, and so on) is large, so the overall contribution to REE is high. Among the needs of this tissue are the synthesis of new cells in the gut, which turns over rapidly, and the work of the lungs.
From the demographic profile of the participants involved in the study described by Figures 2 and 3, their average predicted REE (4) would be 1540 kcal/day (average for men and women), and their expected total daily energy expenditure, as calculated from the Mayo Clinic’s online site, would be 2266 kcal. Thus their REE is about 68% of their total caloric requirement, consistent with what we will see later.
These results tell us that the model, using the sizes and calculated specific energy needs of the organs and organ systems, predicts resting energy expenditure quite accurately. Also, that REE accounts for just under 70% of the total daily energy expenditure. Much of this energy consumption, the portion required by the liver, kidneys, brain, and fat, won’t change much between states of rest and intense muscle activity.
The REE estimated by this method comes close to the value observed by indirect calorimetry, which measures the rate of oxygen-carbon dioxide exchange. But there is still some variation between the measured, and predicted REE values, and the difference persists throughout the range of REE. This variation shows, for example, that two individuals who have the same predicted REE might differ from each other by over 150 kcal in their measured daily REE. What accounts for this difference? (It’s worth pointing out that 150 kcal a day equals 6 kilogram (15 pounds) of fat over a year.)
Energy efficiency at rest
No machine, including the human body, is 100% efficient. Gasoline powered cars convert about 20% of the energy in gasoline to moving the vehicle. Electric cars are better; about 60% of the electrical energy consumed drives the wheels. Both kinds of cars have lower efficiencies if we include all of the costs of getting the energy from its source (from “well to wheels” in the parlance).
As already stated, the products of human energy metabolism are carbon dioxide, water, heat, and ATP, and that metabolism is basically the same in every aerobic tissue. It converts some of the energy derived by the oxidation of foodstuffs to ATP, which is the useful chemical form of energy. The efficiency of this conversion, in terms of ATP generated, is normally about 54%, in organisms ranging from bacteria to fruit flies to humans. The rest of the potential energy in food is converted to heat.
The yield of ATP is a function of the design of the pathways of metabolism. If they were designed to convert more food energy to ATP, the overall process would run more slowly (if you want to know why, talk to a thermodynamacist about non-equilibrium chemical reactions). If it was designed to capture less of the energy as ATP, the pathway could be faster, but the efficiency would be less. What evolution has provided is a Goldilocks solution: just the right amount of ATP produced, equal to about 54% of the energy of food oxidation, so that our normal energy needs are met, without having to consume a lot more fuel. If we were, say, only 10% efficient, we’d overheat while eating like pandas. (Pandas have the same energy efficiency as us, but the bamboo they feed on is poorly digestible because, unlike cows, they can’t digest cellulose. So they have to eat almost all day long.)
From Figure 2, the substrates consumed for energy generation, and thus the heat generated, by some organs is far higher, per gram of tissue, than for others. Most of that heat is distributed through blood flow. That’s why our skin gets warm during intense physical exertion.
Returning to the question of the difference between the predicted and measured REE, something quite fundamental appears to be going on. Different people may indeed have small, but significant, differences in their rate of energy metabolism at rest. Why? When scientists compared outbred (genetically nonidentical) rats, they found that their basic rates of food oxidation varied (5). The differences were shown to result from different degrees of something called coupling, which links energy needs to the rate of oxidation of substrates in mitochondria. Less tightly coupled mitochondria have a higher rate of oxidation for a given energy need; they waste a little more of the available potential energy as heat.
Babies (and cold-adapted adults) have brown fat, in which coupling is less tight than it is in white fat. This means that they will generate more heat, which they need, relative to their energy requirements. The uncoupling in brown fat is due to an “uncoupling protein”. Uncoupling will increase the REE as more fuel is converted to heat. In terms of electrical circuits, it’s like having a low resistance connection across the terminals of a battery that leaks off charge and produces heat. Different degrees of uncoupling might explain part, or even all, of the scatter in Figure 3. And it could answer the plaintive question, “How come my friend can eat anything she wants and not gain any weight, and I have to watch every bite?”
Go To Contents
Sources cited
- Johnstone, A. M., S. D. Murison, J. S. Duncan, K. A. Rance, and J. R. Speakman. 2005. Factors influencing variation in basal metabolic rate include fat-free mass, fat mass, age, and circulating thyroxine but not sex, circulating leptin, or triiodothyronine. Am J Clin Nutr 82:941-948.
- Speakman, J. R., and C. Selman. 2003. Physical activity and resting metabolic rate. Proc Nutr Soc 62:621-634.
- Wang, Z., Z. Ying, A. Bosy-Westphal, J. Zhang, B. Schautz, W. Later, S. B. Heymsfield, et al. 2010. Specific metabolic rates of major organs and tissues across adulthood: evaluation by mechanistic model of resting energy expenditure. The American Journal of Clinical Nutrition 92:1369-1377.
- Mifflin, M. D., S. T. St Jeor, L. A. Hill, B. J. Scott, S. A. Daugherty, and Y. O. Koh. 1990. A new predictive equation for resting energy expenditure in healthy individuals. Am J Clin Nutr 51:241-247.
- Speakman, J. R., D. A. Talbot, C. Selman, S. Snart, J. S. McLaren, P. Redman, E. Krol, et al. 2004. Uncoupled and surviving: individual mice with high metabolism have greater mitochondrial uncoupling and live longer. Aging Cell 3:87-95.
