On March 19, 2023, the New York Times carried a story that began:
It’s one of the great injustices of this era that countries contributing negligible amounts to global carbon emissions are now feeling the most harrowing impacts of climate change. Pakistan, which makes up less than 1 percent of the world’s carbon footprint, had a third of its territory under water in last year’s floods. Parts of Kenya, Ethiopia and Somalia are experiencing the worst drought in 70 years of record-keeping, threatening millions with famine, even though the entire continent of Africa contributes less than 4 percen of global carbon emissions. . . .
Most of us recognize that the world is rapidly warming, and that the warming is being driven by rising carbon dioxide (CO2) levels in the atmosphere. We probably also realize that different parts of the world are differently responsible for the rise in CO2 . Although the rising atmospheric CO2 level is the main driver of global warming, other gases contribute, particularly methane. Their contributions are usually given as CO2 equivalent, or CO2e, the amount of CO2 that would contribute as much to global warming as those gases do. (This is explored in another post.)
Although methane and other gases make a contribution, the data here are about the major factor, CO2 itself, which is a reasonable proxy for all atmospheric pollutants that cause global warming.
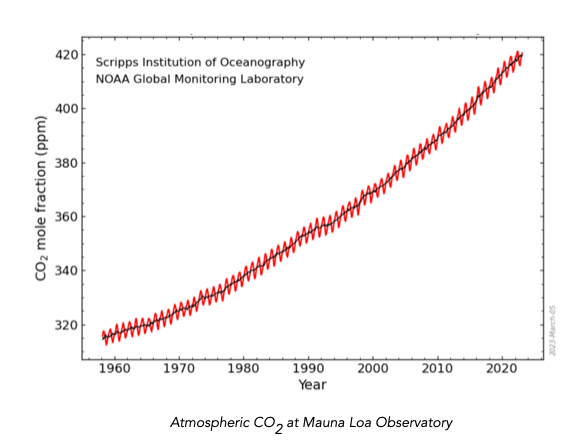
Atmospheric CO2 has been monitored at the Mauna Loa Observatory in Hawaii since 1960, as shown at the top of this post (the original graph can be found here). Remote from large emitters and other perturbations, this record is a good measure of the world-wide change. From a level of 315 parts per million in 1960, CO2 there has gone steadily upward, to the 2021 level of 420 ppm. (Annual fluctuations are caused by CO2 uptake during the greater growth of vegetation in the Northern Hemisphere in summer and its decay in the winter.)
Where does the CO2 come from?
Different parts of the world are differently responsible for the rise in atmospheric CO2 (and its equivalents), as shown in the graph below. It shows the median values of CO2 emission per capita for the groups of countries indicated (average values would show the same differences). The data (from this web site) are in metric tonnes per person per year (1 metric tonne of is 1,000 kilograms of CO2, or about 2,200 pounds; at one atmosphere pressure, 14.2 tonnes of CO2 occupies the same volume as 4 olympic swimming pools).

Median CO2 emissions in 2021. The data are in tonnes (1,000 kg) per capita. That year was slightly lower than 2019, in part because the Covid pandemic had reduced economic activity, and partly because some countries have begun to reduce their emissions.
At the top end are petrostates in the Middle East, which have a median value of 20.5. However, because their populations are relatively small, they do not contribute a great deal to the global total. A little below them are some modern industrialized countries, including the United States, which produce 14.2 tonnes per capita per year. Significantly below these are a large cluster of advanced, modern, mostly European countries that produce about half as much per capita as the second largest group. The reasons for this difference, between for example Canada and France, are several, and would be worth exploring.
Producing almost microscopic levels of CO2 per capita, less than 2% of the level generated in the USA and Canada, are the sub-Saharan African countries. These are some of the countries referred to in the New York Times article that are suffering from the great injustice. They have not benefitted nearly as much from CO2 emission as the industrialized countries, but are paying a heavy price for the CO2 emitted by them. We rich folk are ruining the world, and they are suffering most of the consequences. Countries not shown, but also suffering disproportionately, include India (1.90 tonnes/capita), Pakistan (1.04), and Bangladesh (0.62).
***************************************
International air travel makes a significant contribution to global CO2e levels. Long flights require a lot of jet fuel, which ends up as CO2. Other factors, such as the effects of the water contrails and particle emissions, also contribute CO2e. It is difficult to calculate the exact value for air travel, which depends on the length of trips, seat occupancy, and equipment used. But the number shown in the graph, about 2 tonnes of CO2e to haul one tourist from Chicago to Paris and back, is a reasonable estimate. And the problem this presents will not be fixed by technology any time soon: currently, biofuels are having a moment, but they simply won’t reduce overall consumption significantly. They are more virtue signals than virtues.
The comparison between 1 person flying from North America to western Europe and back, and the annual CO2 production by people living south of the Sahara, is stark. It’s small wonder that some people have foresworn long distance air travel.
To finish with the continuation of the Times story:
Helping the poorest of the poor will increasingly mean ensuring access to drought-resistant seeds and access to water as lakes dry up. In middle-income countries, promoting shared prosperity will increasingly mean expanding access to reliable, affordable clean energy. The World Bank has . . . begun to help countries incorporate climate change into their overall economic development plans and should continue this necessary work.
