The environmental cost of beef production is well known: it generates a lot of greenhouse gases (GHG), compared to plant-derived foods or even meats such as pork or chicken. A major reason is that bovines’ stomachs use oxygen-free, “enteric” fermentation to digest grass, as described in a previous post. As a result, they burp up a lot of methane, which is a potent GHG.
The greenhouse gas contributions of methane, nitrous oxide, and fluorinated gases are encompassed by the term “CO2 equivalents” (CO2e). Their respective CO2e values represent the amount of CO2 that would have the same GHG effect on the atmosphere. CO2e is a common currency that measures the total impact of all greenhouse gases, and the CO2e values of different foods measure the contribution of their production, farm to table, to atmospheric greenhouse effects.
Although the production of beef imposes a high cost in terms of CO2e, it’s important to assess this environmental issue as accurately as possible. One reason is so that efforts to reduce CO2e can be brought to bear. Another is to counter arguments that beef production really isn’t a significant problem.
The CO2e Costs of Beef Are Variable
As a first step in a quantitative assessment, it’s important to recognize that the CO2e values for a particular food can vary, depending on external factors. Recent articles in the New York Times (1, 2) quoted values for the CO2e of beef taken from a comprehensive scientific paper (3). But that value was a global average, and does not reflect the environmental cost of raising beef in America, Europe or other first-world countries.
In fact, the CO2e of beef produced in first-world countries is significantly lower than the global average. A publication in The Proceedings of the National Academy of Sciences in 2013 (4) details enormous differences in GHG emissions for beef production in different parts of the world. The most important factor is the quality of feed: the high quality (i.e. protein content) of feed used in the USA and Europe results in much lower levels of methane production by the cattle, which results in a lower CO2e. Chewing and digesting large quantities of grass generates more methane than eating smaller quantities of grain. Methane production by bovines can vary by more than 15-fold between regions with the highest quality of feed (North America, Europe) and the lowest (South and East Asia, Sub-Saharan Africa) (4). Of all of the GHG emissions due to meat production from ruminants (mostly beef and lamb), more than 75% come from the developing world.
The production emissions for beef (the amount of CO2e generated by all activities that take place before the beef leaves the farm) in OECD countries (mostly European) have been reported to be about 20 kilograms (44 pounds) of CO2e per kilogram (2.2 pounds) of beef produced (5). Another source (6) indicates that 24 kilograms of CO2e is generated per kilogram of beef produced on American farms. Another 3 kilograms is linked to “post farm gate emissions”, which include everything from transportation to refrigeration to cooking and waste disposal (6).
About 27 billion pounds of beef was produced in the USA in 2018 (7). At 27 kilograms CO2e generated per kilogram of beef, the CO2e cost of this production is 2.8 kilograms of CO2 per person per day, or just over 6 pounds. The total American CO2e footprint is 55.6 kilograms (122 pounds) per person per day, which includes all activities anywhere in the USA (including transportation and industry) that produce CO2. So eating beef contributes 5% (2.8/55.6) to total GHG production in the USA. (Incidentally, that level of beef production provides 100 grams of beef per person per day. A quarter-pounder.) The contribution of beef production to total GHG emissions (5%) in North America is of course due to the fact that we eat a lot more beef than people in the poorer countries. Worldwide, despite higher GHG per kilogram of beef produced in developing world countries, methane from beef production contributes about 3% of total GHG.
Five percent is still a big number, and we should reduce it. But it’s not as high as reported in the Times articles (1, 2), nor in the scientific publication those numbers were taken from (3): that number was 9.2 kg CO2, or 16.5% of the total daily generation of GHG in the USA. That number doesn’t make sense, because all of food production accounts for only 20% of the total CO2e emissions in the USA. (The contribution of food production to total CO2e is similar in other countries, cf. reference 8. But the absolute amounts of both food-related, and total, CO2e, is much lower.)
What About Dairy?
Analyses of GHG generation by food production often include dairy products (“Wait — cheese might be worse than chicken?” ask the authors of one of the Times articles) (2). But milk, and other dairy products, actually aren’t as costly, in terms of GHG emissions, as meat. And as for beef production, the high quality of feed used in Europe and the USA means the GHG emissions, per liter of milk, are much lower than in countries using the poorest feed (4). For every kilogram of milk protein, the GHG cost is less than 30% as high, in terms of CO2e, as the GHG cost of producing one kilogram of beef protein. The GHG emissions due to milk production in some parts of the world (South and East Asia, Sub-Saharan Africa) is more than ten times higher than in first world countries.
Interpreting The Numbers
One way to appreciate the effect of a particular dietary component on GHG emissions is to see how much CO2e it would contribute, if it were the sole source of calories in the diet. The average person in the USA needs about 2,300 kcal a day, depending on age, activity level, and gender. (This is the number actually consumed: the amount of food produced is, astonishingly, 60% higher. The difference represents waste, about which I will say more.) A 2,300 kcal diet consisting of a single type of food would produce, in terms of GHG, the following amounts of CO2e each day if only that food were consumed (a “monodiet”):
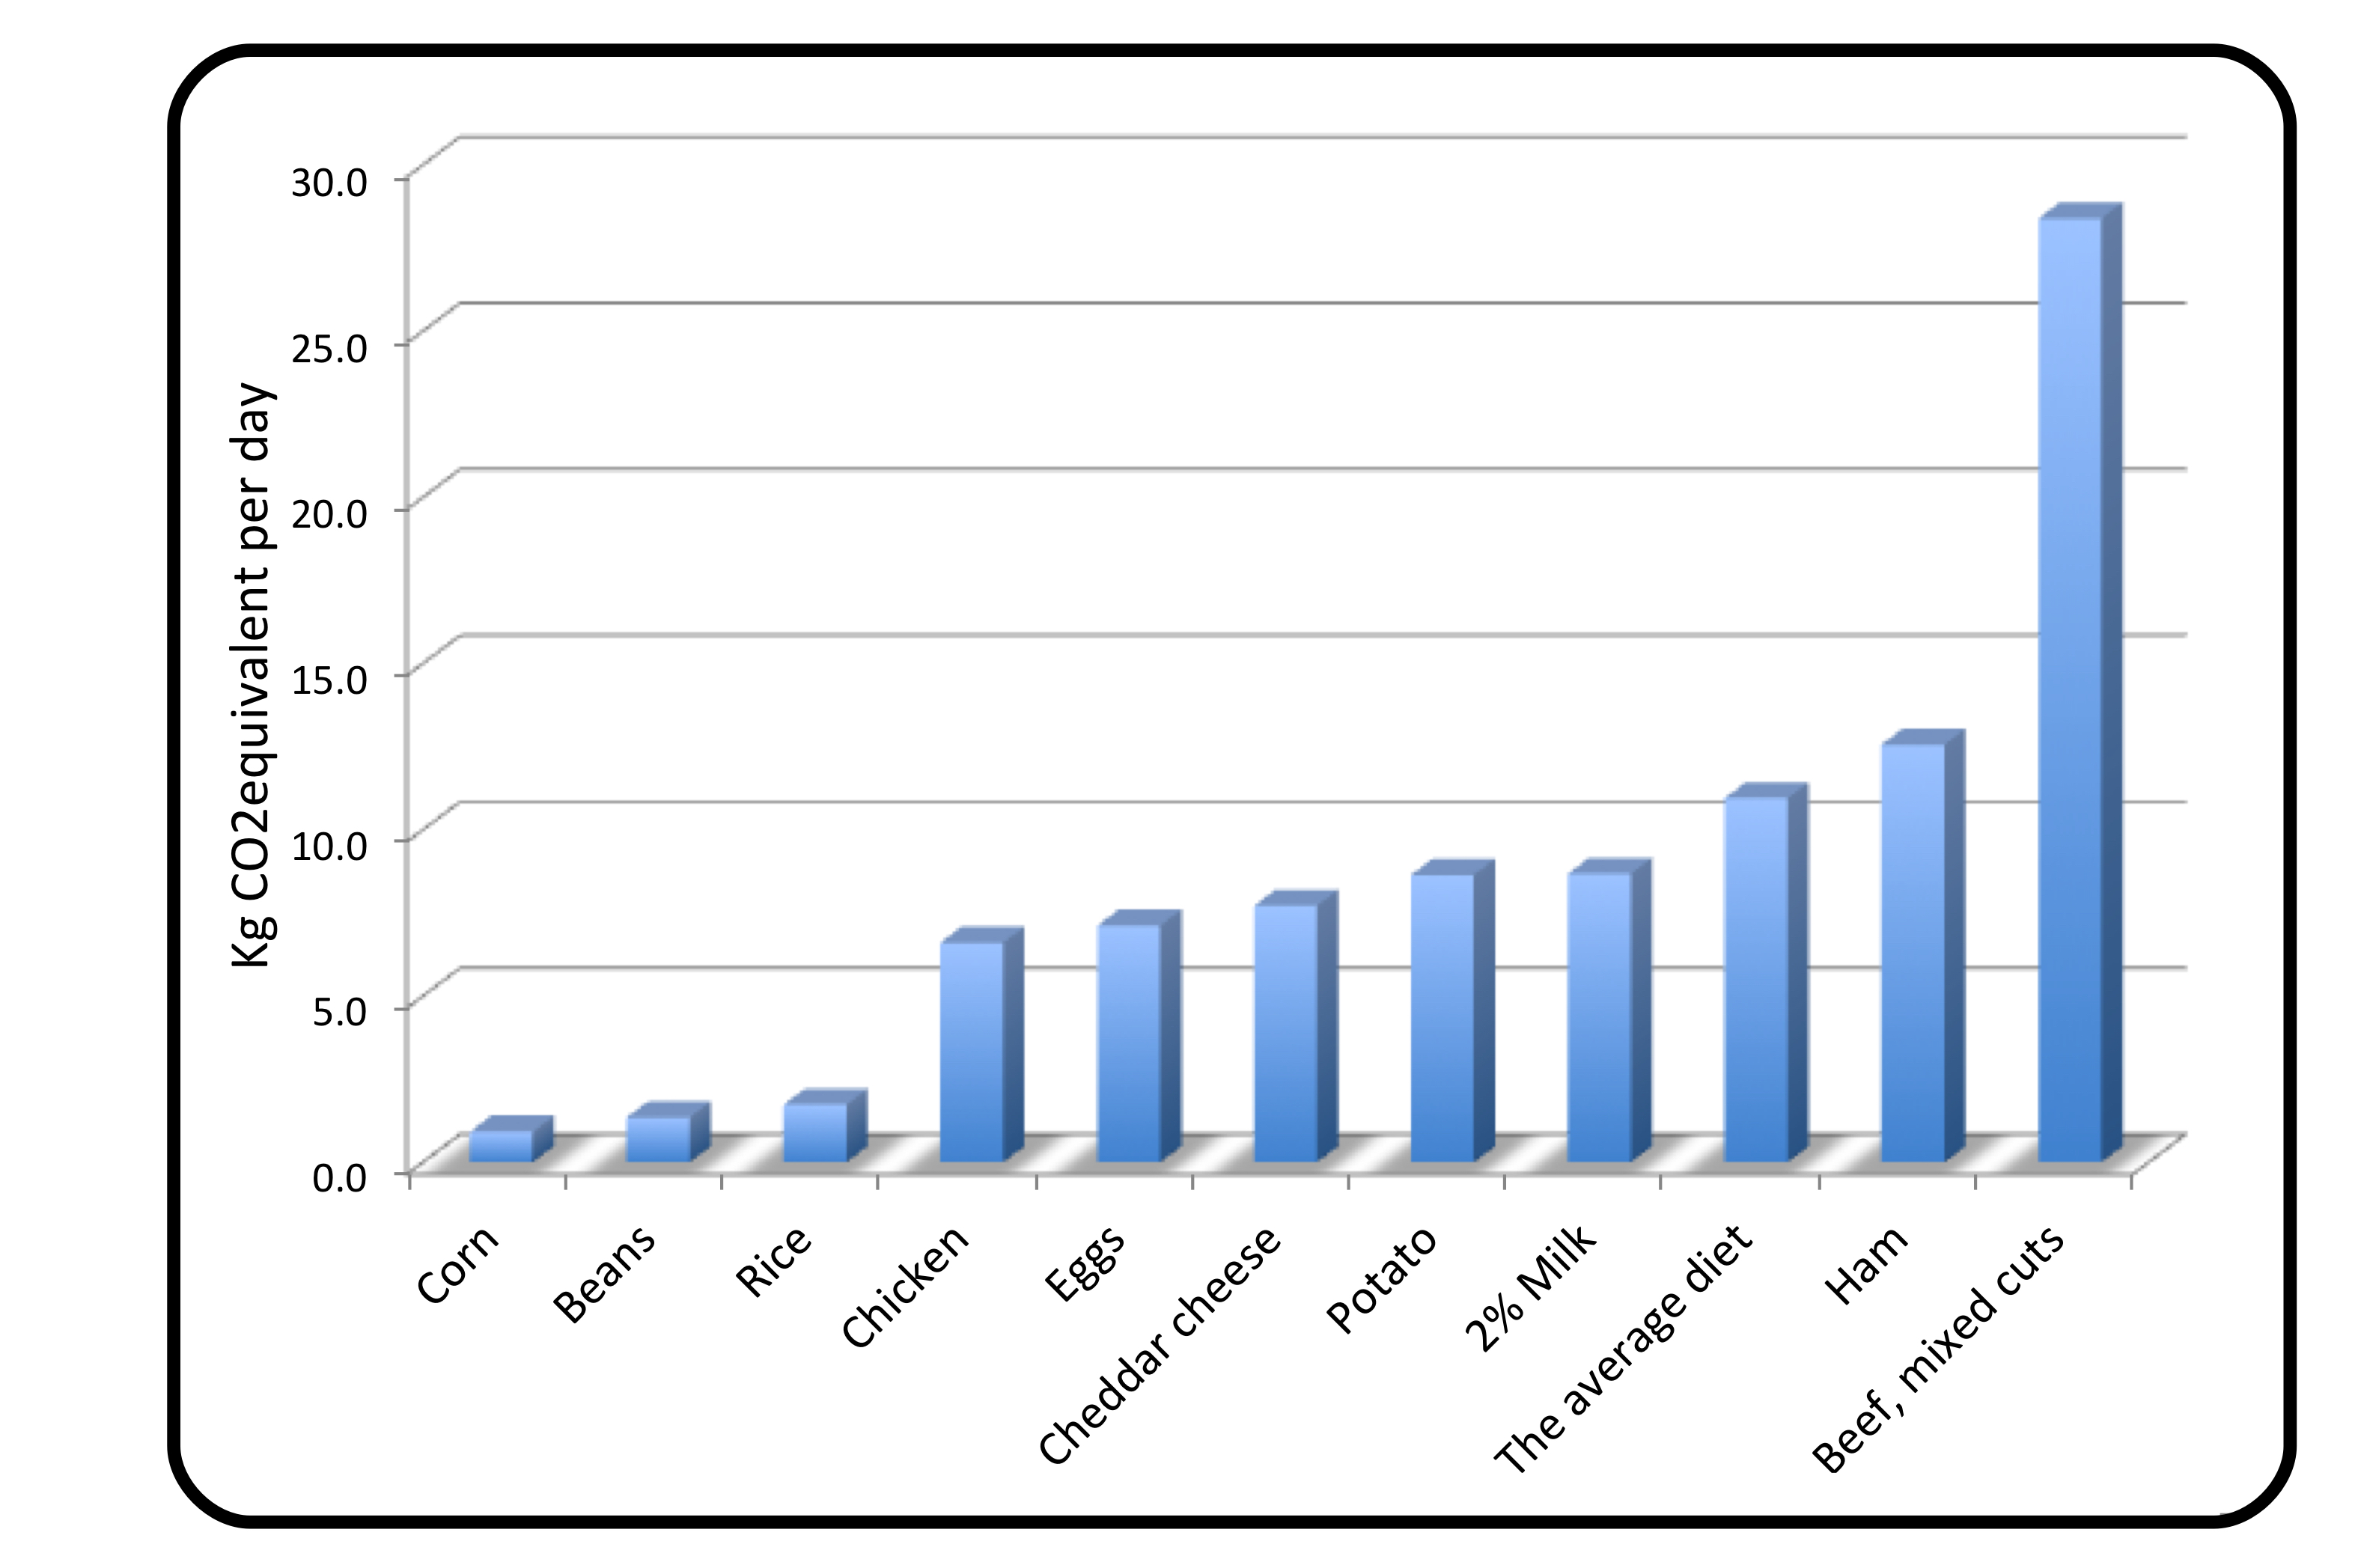
If everyone in the USA ate only beef, the production of CO2e, the total carbon footprint, presently 55.6 kilograms per day of CO2e, would go up by 31%. In fact, it would be even worse than this, because food wastage, briefly described below, is higher for meats than for other foods. Of course, nobody does consume a strictly beef diet. Few of us live exclusively on “virtuous” foods like corn, beans and rice either, although those that do have a 17% smaller total carbon footprint than the average person living on the present, mixed, diet. Worth thinking about.
Chickens, eggs and dairy are often linked to high GHG emissions, but they aren’t any higher than the average diet. Pork is just slightly higher than the average, and chicken is significantly lower. If only we would treat farm animals, particularly pigs and chickens, and also cows, more humanely! Cheese is usually rated as bad for the environment because it produces a large amount of CO2e per kilogram (6), but it also contains a lot of energy: over 4,000 kcal in a kilogram of cheddar. Only slightly higher, in terms of CO2e per kcal, than chicken or eggs.
The Waste of Food
When I ask Mr. Google “How many calories do Americans eat per day?” the answer at the top of page one is “3,600 kcal”. The “WorldAtlas.com” provides an even larger number, 3,750 kcal. But if we really ate that much food, we’d blow up like balloons; the current epidemic of obesity would look like nothing. For anyone with even a passing acquaintance with human diet, those numbers sound far too big, and other sites suggest far lower values, around 2,300 kcal averaged over the entire population and all levels of activity. The difference between those numbers, with one 63% higher than the other, is not a misprint: it represents the difference between food produced (in the USA) and food actually consumed.
Another way of looking at the difference between those numbers is that about 39% of the food produced disappears before being eaten, in keeping with the US Department of Agriculture estimate that 30-40% of food produced is wasted (11). The waste occurs at all levels: imperfect produce rejected or used to feed animals instead of humans; spoilage on the way to the supermarket; being discarded because an (often fatuous) expiry date; and, particularly, being thrown out at home.
Another number that reflects the inefficiency of our food production systems, in terms of environmental damage, is its cost in fossil fuel energy, as described in an earlier post. Present estimates are that about 15 kcal of fossil fuel energy are required to produce 1 kcal of food in North America. This number is rising, and some experts think it’s closer to 20. Of course, this is a part of the GHG emission cost, although it isn’t the same thing — the belching of cows isn’t due to fossil fuel emission. The energy cost of producing food has gone from 1 kcal to the present 15 or so between 1900 and today. This is part of our drive to make food production cheaper, and it too is a reflection of waste.
Agriculture, plus food-related processes beyond the farm gate, contribute about 20% to total GHG emissions in the USA, similar to other countries (8). The absolute GHG associated with food in the US is larger than for most other countries, but so is the total carbon footprint, so the percent is about the same. The waste of food (30-40%) then represents 6-8% of our total GHG production, more than our consumption of beef (5%). We need to reduce both.
The Waste of Energy
A more important number for US Americans, and Canadians, bigger than the environmental cost of eating beef, is simply the magnitude of the total CO2e generated by our way of life. If we combine the CO2e for the four largest European countries, Germany, France, UK and Italy, the average is 23.9 kilograms per person per day, which is down 22% from 1990 (9). The US value is 55.6 kilograms per person per day, 233% of the European one, and up 1% from 1990 (although it’s down 12% from 2005) (10). Despite producing just 43% as much greenhouse gas per capita, Europeans live well.
Conclusions? Beef is expensive in terms of greenhouse gases, but not as expensive as sometimes reported. Dairy, eggs, and other meats are not nearly as costly as beef, per kcal of food energy. Food wastage is a bigger culprit than beef consumption. And the major environmental damage in North America is due simply to the excessive amount of energy we use, with its concomitant yield of CO2e.
The late Sir David MacKay wrote the user-friendly bible on environmental energy issues. (Check out this website to get a free copy of his magnum opus “Sustainable Energy Without the Hot Air”; although he died in 2016 it’s still relevant.) MacKay’s mantra was that it’s important to use numbers, not adjectives, if we want to understand important environmental issues. And we need to use the right numbers. The damage to the environment may look a little different if we do, and our evaluation of relative costs may be affected. Regarding our food, another guru, Michael Pollan, says, “Eat food, not too much, mostly plants.”
Go To Contents
Sources of information:
1. “The Meat-Lover’s Guide to Eating Less Meat”, Melissa Clark, NYT, December 31, 2019 (updated January 2, 2020). https://www.nytimes.com/2019/12/31/dining/flexitarian-eating-less-meat.html?searchResultPosition=1
2. “Your Questions About Food and Climate Change, Answered”, Julia Moskin, Brad Plumer, Rebecca Lieberman and E. Weingart, NYT April 30, 2019. https://www.nytimes.com/interactive/2019/04/30/dining/climate-change-food-eating-habits.html
3. “Reducing food’s environmental impacts through producers and consumers”, J. Poore and T. Nemecek, Science (2018) 360: 987. https://science.sciencemag.org/content/360/6392/987
4. “Biomass use, production, feed efficiencies, and greenhouse gas emissions from global livestock systems”, M. Herrerro et al., Proc. Natl. Acad. Sci. USA, (2013) 110: 20888. https://www.pnas.org/content/pnas/110/52/20888.full.pdf
5. “Comparing environmental impacts for livestock products: A review of life cycle assessments”, M.de Vries and I. J. M. de Boer (2010) Livestock Science, 128:1.
6. “The Meat Eater’s Guide” https://www.ewg.org/meateatersguide/a-meat-eaters-guide-to-climate-change-health-what-you-eat-matters/climate-and-environmental-impacts/
7. https://beef2live.com/story-beef-production-year-0-107550
8. “Energy-Smart Food For People and Climate”, UN Food and Agricultural Organization http://www.fao.org/3/i2454e/i2454e00.pdf
9. “Eurostat Statistics Explained” https://ec.europa.eu/eurostat/statistics-explained/index.php?title=File:Total_greenhouse_gas_emissions_by_countries,_1990-2017_(Million_tonnes_of_CO2_equivalents).png
10. Center for Climate and Energy Solutions https://www.c2es.org/content/u-s-emissions/
11. “Food Waste FAQs”, US Department of Agriculture https://www.usda.gov/foodwaste/faqs

.png)